Authors


Partners

This work is funded by the City of Toronto.
Contributors
- Nina Rafeek
- Zaynab Choudhry
- Cathy McKim
May 2024

This work is funded by the City of Toronto.
Bold idea: Closing the digital divide in Toronto and enabling more equitable outcomes will require a broad lens on digital inclusion that focuses on affordability and digital literacy.
In recent years, the City of Toronto has been making advancements to overcome significant disparities in internet access within the City. However, some significant gaps remain and need to be addressed in order to fully close the digital divide.
To understand the current state of the digital divide in Toronto and see how that has changed since 2020, we reconducted a multimodal survey of 2,500 Toronto residents (2,000 online responses and 500 telephone responses) in December 2023. Key findings were:
The overall picture in Toronto remains similar to that seen in 2020, though with noticeable improvements in internet speed. As Toronto looks forward to the next stages of its digital transformation, taking a broad lens of digital inclusion — a multilayered approach that starts with access, followed by ability, and finally benefits — will provide better and more equitable outcomes for residents. Only when all residents have both access to adequate internet and the skills to use it effectively will we have fully overcome the digital divide.
Home internet in Toronto is approaching universal access — 98% of residents have internet service in their home. This is consistent with the results of the 2020 study, when we also found that 98% of residents have home internet access, and similarly consistent (though slightly higher) than the most recent 2022 results of the Canadian Internet Use Survey (CIUS) that found 96% of residents in the City of Toronto have home internet access. However, given the size of Toronto, 2% of the population lacking home internet means that nearly 60,000 Torontonians lack internet at home.

Table 1
Home Internet Connectivity by Household Income
| Household Income | Less than $30,000 | $30,000 to less than $50,000 | $50,000 to less than $70,000 | $70,000 to less than $100,000 | $100,000 or more | |
|---|---|---|---|---|---|---|
| Home Internet Access | Yes | 95% | 96% | 99% | 99% | 100% |
| No | 5% | 4% | 1% | 1% | 0% |
Comparatively, according to the CIUS, 94% of all Canadians have access to the internet at home. Focusing more closely on those living in large urban areas (in this case, either Census Metropolitan Areas or Census Agglomerations), 95% of residents have internet access. This suggests that the City of Toronto has slightly better home internet connectivity than its closest peers.
Connectivity has also improved among older residents of Toronto. In 2020, only 95% of those aged 60 and older said they had home internet access, compared to 97% in 2023.
Although only 2% of respondents (n=47) indicate that they do not have home internet access, the survey provides a detailed profile of who those residents are and why they do not have internet access at home.
Across all demographic groups, more than 90% of respondents indicate that they have a home internet connection. However, lower-income households are generally less likely to have home internet — in households earning less than $30,000 before taxes, 5% say they do not have home internet. Comparatively, in households earning $100,000 or more, that figure is less than 1%.
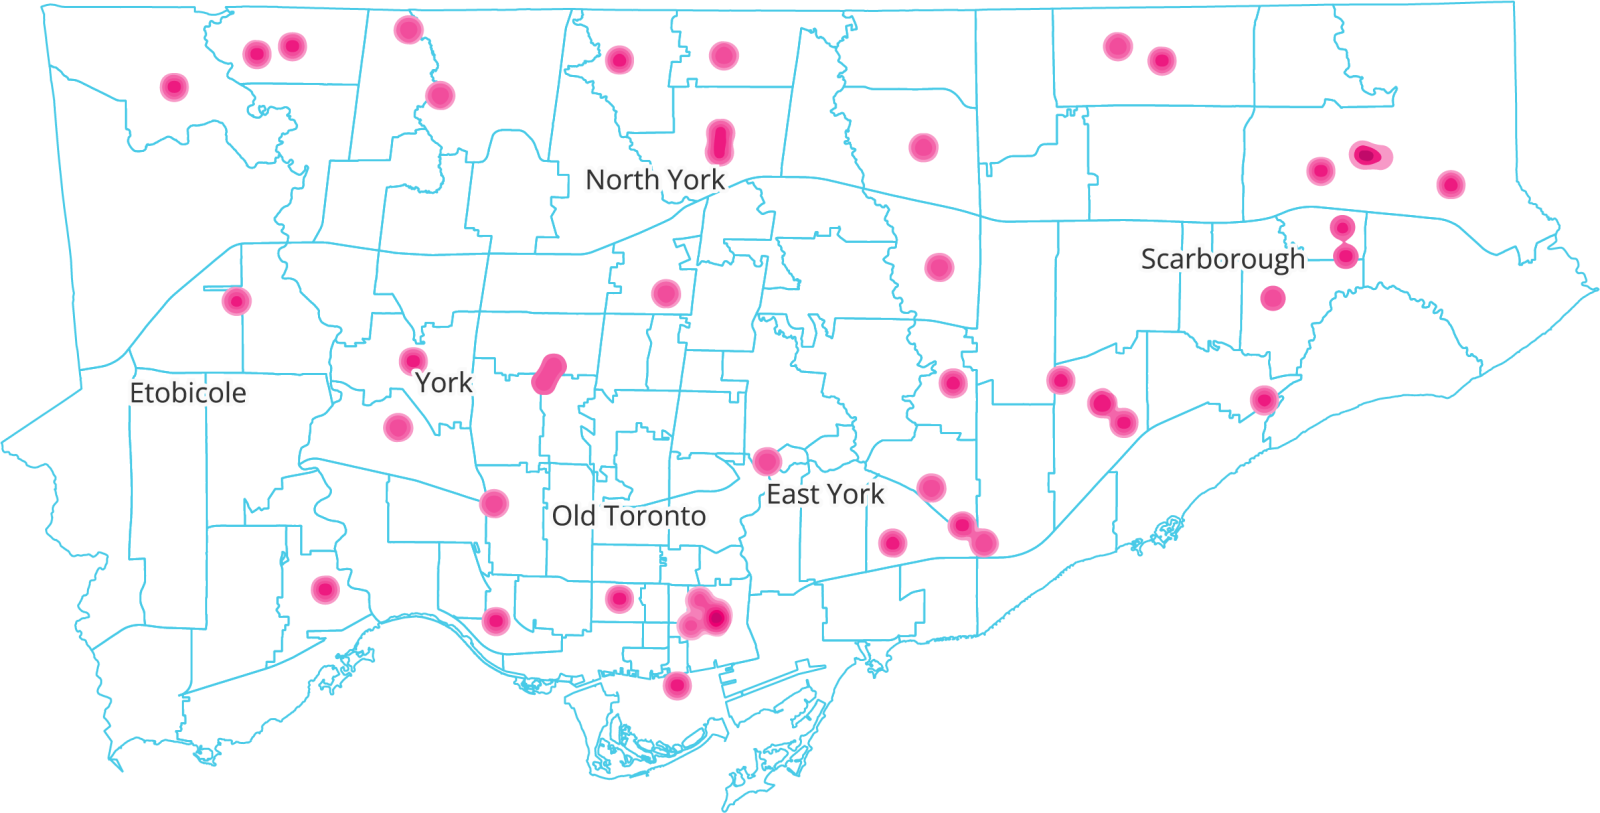
Figure 2 depicts the location of households within the City of Toronto without home internet access. Caution is recommended in extrapolating significance from any individual point given the small sample size (n=47). However, there are patterns and particular areas that were of note.
There are nine areas of note with less than 96% rates of home internet access. In most cases, these include either neighbourhoods that are designated as Neighbourhood Improvement Areas or Emerging Neighbourhoods, although some areas encompass neither. These regions are:
Figure 2
Heatmap of Households with No Home Internet
Among residents who do not have home internet, the most commonly cited reason is the cost of the service: 39% mention it as a reason. While this is not surprising given the relatively high cost of broadband internet in Canada, it underscores the need for Canada to address the cost barrier of internet services for lower-income people.

The next most commonly cited reason is that they can use a mobile data plan instead. With 96% of Toronto residents saying they have mobile cell data, this is a real alternative that many residents have access to. This is consistent with CIUS data for Canada as a whole, that shows 12% of Canadians without home internet use either their cell phone or some alternative form of access. However, cost remains an important factor for cell phone data as well. Similar to home broadband, Canada has very high cell phone data costs, which we explore in more detail in the section on Affordability.
Similarly, many residents without home internet cite their ability to access the internet outside of their home, including places like work, libraries, businesses, and more. As we move out of restrictions resulting from the pandemic, the ability to access the internet at other locations outside the home has increased, as we discuss in the Internet Outside the Home section.
Importantly, Toronto residents without home internet still think they need it. Only 8% say they have no need or interest in the service, slightly higher than we found in 2020, but much lower than other barriers to home internet. Despite being higher than in 2020, this is significantly lower than what was found in the most recent CIUS study — which suggested that, across Canada, 59% of households without internet access say they do not have it because they have no need for it.
Compared to the 2020 survey, our 2023 survey shows there has been an overall decrease in use of home internet to access a range of government, financial, and health services. This study was first conducted in December of 2020, at a time when the COVID-19 pandemic was a major public health emergency and the City of Toronto was taking significant measures to limit its spread.

Table 2
Uses of Home Internet by Household Income
| Household Income | Less than $30,000 | $30,000 to less than $50,000 | $50,000 to less than $70,000 | $70,000 to less than $100,000 | $100,000 or more | |
|---|---|---|---|---|---|---|
| Services Accessed | Work | 38% | 48% | 52% | 66% | 75% |
| Education | 43% | 38% | 38% | 42% | 45% | |
| Healthcare | 38% | 38% | 48% | 51% | 58% | |
| Government services or information | 53% | 57% | 63% | 66% | 74% | |
| Financial services or Banking | 63% | 75% | 82% | 82% | 89% | |
| Don't know or prefer not to say | 16% | 8% | 6% | 4% | 3% |
That said, the internet remains a critical way in which Toronto residents access essential services and go about their daily lives. Nearly four in five Toronto residents used the internet in the last six months to access banking services, 63% used it to access government services, and 41% used it to access healthcare services. As Table 2 shows, lower-income households are less likely to use home internet to access work, healthcare, banking and government services, while rates of access to online education are consistent across income levels.

The impact of not having home internet access is felt by Toronto residents on all these fronts. Access to government information is the most cited impact, followed closely by financial services. Most positively, only 14% say that lacking home internet impacted their ability to work. This may be because when residents don’t have home internet due to financial challenges, but they require it for work, it is easier to justify the expense.
Comparing how those with internet access use it to the impacts felt by those without a connection, it seems that, in most cases, residents are able to find alternative ways of accessing the services they need. When it comes to government and financial services, most residents with internet access say they used it to access services in some way. However, fewer than a third of those without internet access say it was a barrier to accessing those services. This suggests that, in both cases, there are alternative pathways to access these services.
Conversely, when it comes to education, it seems to be more difficult to find alternatives without internet access. While 41% of those with internet access have used it for educational purposes, 24% of those without access have felt its impact on their education. That ratio of less than 2:1 is the highest across all areas included in the survey, suggesting it is the most difficult area to find alternatives.
While home internet access has become nearly ubiquitous in Toronto, it is not the only way residents access the internet. As discussed previously, cell phone data is nearly as universal in Toronto as home broadband, with 96% of residents having access to cell data. Because of this, nearly 70% of residents report having used their data plan to access the internet outside of their home. However, this is far from the only other place Toronto residents are going online.
Workplaces, businesses like malls or coffee shops, and other people’s homes remain very common places to access the internet. Since 2020, the biggest change in this regard has been the use of the internet at other public locations like airports or subway stations. Now, nearly half of all residents report using the internet at these locations. This is in line with the re-opening of public spaces as restrictions resulting from the COVID-19 pandemic have decreased since December 2020.

Table 3
Internet Access Locations by Household Income
| Household Income | Less than $30,000 | $30,000 to less than $50,000 | $50,000 to less than $70,000 | $70,000 to less than $100,000 | $100,000 or more | |
|---|---|---|---|---|---|---|
| Location of Internet Access | At work | 28% | 38% | 48% | 57% | 63% |
| At a public library | 32% | 25% | 21% | 20% | 18% | |
| At a business like a mall | 39% | 40% | 47% | 45% | 56% | |
| At someone else’s home | 42% | 47% | 48% | 54% | 57% | |
| Outside your home using your mobile phone data plan | 61% | 58% | 67% | 75% | 76% | |
| At school or an education institution | 26% | 17% | 17% | 17% | 20% | |
| At another public location | 40% | 44% | 45% | 43% | 54% |
Somewhat counterintuitively, in most cases, those with home internet are also more likely to access the internet at any given non-home location. The only exception to this is public libraries — 21% of those with home internet have used Wi-Fi from a public library in the last year, compared to 39% of those without home internet. For those without home internet, the library is the third most common location for internet access, only behind cell phone data plans and other public spaces.
Cell phone data also clearly serves as an important stopgap for many without home internet. As noted earlier, many Torontonians without home internet made that choice because they can use their cell phone data instead. Indeed, 85% of those without home internet say they have a cellular data plan, leaving only 0.2% of Toronto residents with neither home internet nor a cell phone data plan.
The CRTC has a goal for Canada to have universal access to home broadband internet with download speeds of at least 50 megabits per second (Mbps) and upload speeds of at least 10 Mbps.12 High-speed internet like this is fast enough to comfortably stream high-definition television, or download music and videos. Innovation, Science and Economic Development Canada reports that, as of 2022, 93.5% of households in Canada now have the option to subscribe to high-speed internet, and they have set a target for 2026 to have 98% of households with access to the same.13 Despite the significant challenges in Canada posed by our geography, average internet speeds are globally competitive. A recent study ranks Canada as 13th globally for average internet speeds.14
That said, given the high cost of broadband internet, there is a significant difference between the internet speed that is available and the internet speed that residents choose to pay for. It’s important to differentiate between three different ways of discussing home internet speed: maximum available internet speeds; maximum subscription speed of an internet connection shared by all that subscription’s users; and average speed experienced by internet users.
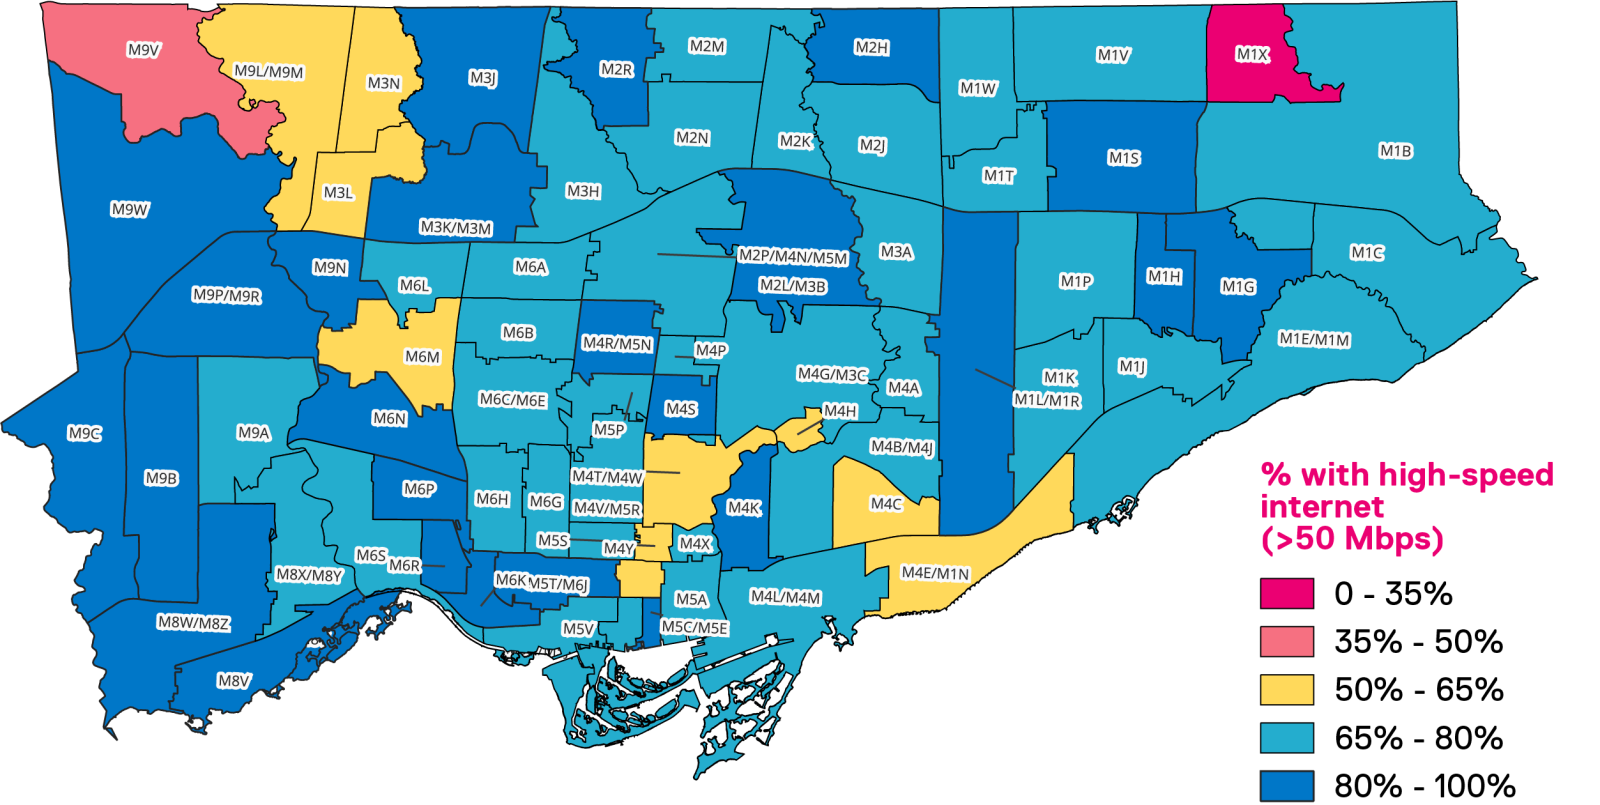
Nearly three-quarters (74%) of residents report having high-speed internet (more than 50 Mbps download), with nearly half saying they have internet speed above 100 Mbps. This represents a combination of two types of responses — some respondents will have answered based on the speed of their internet as described by their internet service provider; however, the survey included a link to a speed test for those who were unsure what their internet speed is. The intention was to improve the response rate to the question — without providing access to a speed test, there is a significant risk that those who pay less attention to their internet speed would not have responded. Because of this, another set of respondents will instead have described the average internet speed they were experiencing at the time of the survey, which in some cases will have been lower than when respondents reported the promised speed from their ISP.

Table 4
Internet Speeds by Household Income
| Household Income | Less than $30,000 | $30,000 to less than $50,000 | $50,000 to less than $70,000 | $70,000 to less than $100,000 | $100,000 or more | |
|---|---|---|---|---|---|---|
| Reported Internet Speed (including those who don’t know) | Less than 10 megabits per second (Mbps) | 7% | 3% | 2% | 2% | 1% |
| 10 to less than 20 Mbps | 10% | 9% | 5% | 4% | 2% | |
| 20 to less than 50 Mbps | 18% | 17% | 12% | 12% | 11% | |
| 50 to less than 100 Mbps | 13% | 19% | 22% | 21% | 21% | |
| 100 or more Mbps | 27% | 32% | 39% | 40% | 46% | |
| Don't know or prefer not to say | 25% | 20% | 20% | 21% | 19% |
These speeds represent a significant improvement from those reported in 2020. At the time, only 61% of respondents report high-speed internet access at home, including only 36% reporting speeds faster than 100 Mbps. Conversely, 17% report speeds below 20 Mbps — a figure that has since dropped to only 10%. However, those living in multi-unit houses are more likely to have slower internet speeds, with 15% saying they have internet that is less than 20 Mbps.
Otherwise, there is little difference in internet speeds across different types of housing. Among those living in houses, 64% have high-speed internet. Comparatively, 63% of those living in apartments have high-speed internet, 64% of those in multi-unit houses have high-speed internet, and 67% of those in townhouses have high-speed internet.
There is a significant difference in internet speed between those who are employed and work from home, and those who are employed but work outside the home. More than three-quarters of those working from home have high-speed internet and half have speeds above 100 Mbps, while only 69% of those who work away from home have high-speed internet and only 41% have speeds over 100 Mbps.
While not everyone is receiving high-speed internet, there are major differences in how households use the internet, resulting from differences in their needs. While high-speed internet is important for those who stream high-definition video frequently, other households might only use the internet for email or to check social media, where speed requirements are much lower.
Only 7% of Toronto residents describe their internet as either slow or very slow, while 91% say their internet is at least adequate, including 51% who say their internet is fast or very fast.

Table 5
Perceived Home Internet Speed by Household Income
| Household Income | Less than $30,000 | $30,000 to less than $50,000 | $50,000 to less than $70,000 | $70,000 to less than $100,000 | $100,000 or more | |
|---|---|---|---|---|---|---|
| Perceived Internet Speed | Very slow | 4% | 2% | 0% | 1% | 1% |
| Slow | 10% | 5% | 4% | 7% | 4% | |
| Adequate | 41% | 44% | 41% | 41% | 35% | |
| Fast | 30% | 34% | 36% | 34% | 38% | |
| Very fast | 14% | 14% | 17% | 17% | 22% | |
| Don't know or prefer not to say | 2% | 1% | 1% | 0% | 0% |
The distribution of households with high-speed internet is not equal across Toronto. Similar to the distribution of any home internet, those with higher household incomes are more likely to have high-speed internet — only 53% of households earning under $50,000 a year have high-speed internet, compared to 84% of households earning $100,000 or more.
Additionally, more recent migrants to Canada are less likely to have high-speed internet. While there’s no strong relationship between immigration and having any home internet, only two-thirds of those who recently immigrated to Canada (in the past 10 years) have high-speed internet. When it comes to age, the gap between older and younger residents has closed. In 2020, only 52% of those aged 60 and older reported having high-speed internet, while now 72% among this age group say they have high-speed internet.
That said, not all residents will need high-speed internet to be satisfied with the connection they have. Comparing reported speeds to how residents describe them, we find that, among those with the slowest internet (less than 10Mbps download speed), only 65% say they have at least adequate internet. Once speeds move up to 10 to 20 Mbps, that share who are satisfied with their internet jumps to 84%, including a total of 25% who say they have fast or very fast internet.
Table 6
Perceived Internet Speed by Actual Internet Speed
| Actual Internet Speed | <10 Mbps | 10 to 20 Mbps | 20 to 50 Mbps | 50 to 100 Mbps | 100+ Mbps | Didn’t answer | |
|---|---|---|---|---|---|---|---|
| Perceived Internet Speed | Very slow | 12% | 7% | 0% | 0% | 0% | 0% |
| Slow | 21% | 9% | 9% | 5% | 2% | 4% | |
| Adequate | 51% | 59% | 61% | 47% | 26% | 42% | |
| Fast | 12% | 22% | 27% | 39% | 37% | 38% | |
| Very fast | 2% | 3% | 2% | 9% | 35% | 11% | |
| Didn't Answer | 2% | 0% | 0% | 0% | 0% | 4% | |
| At least adequate | 65% | 84% | 90% | 94% | 98% | 91% |
Figure 9
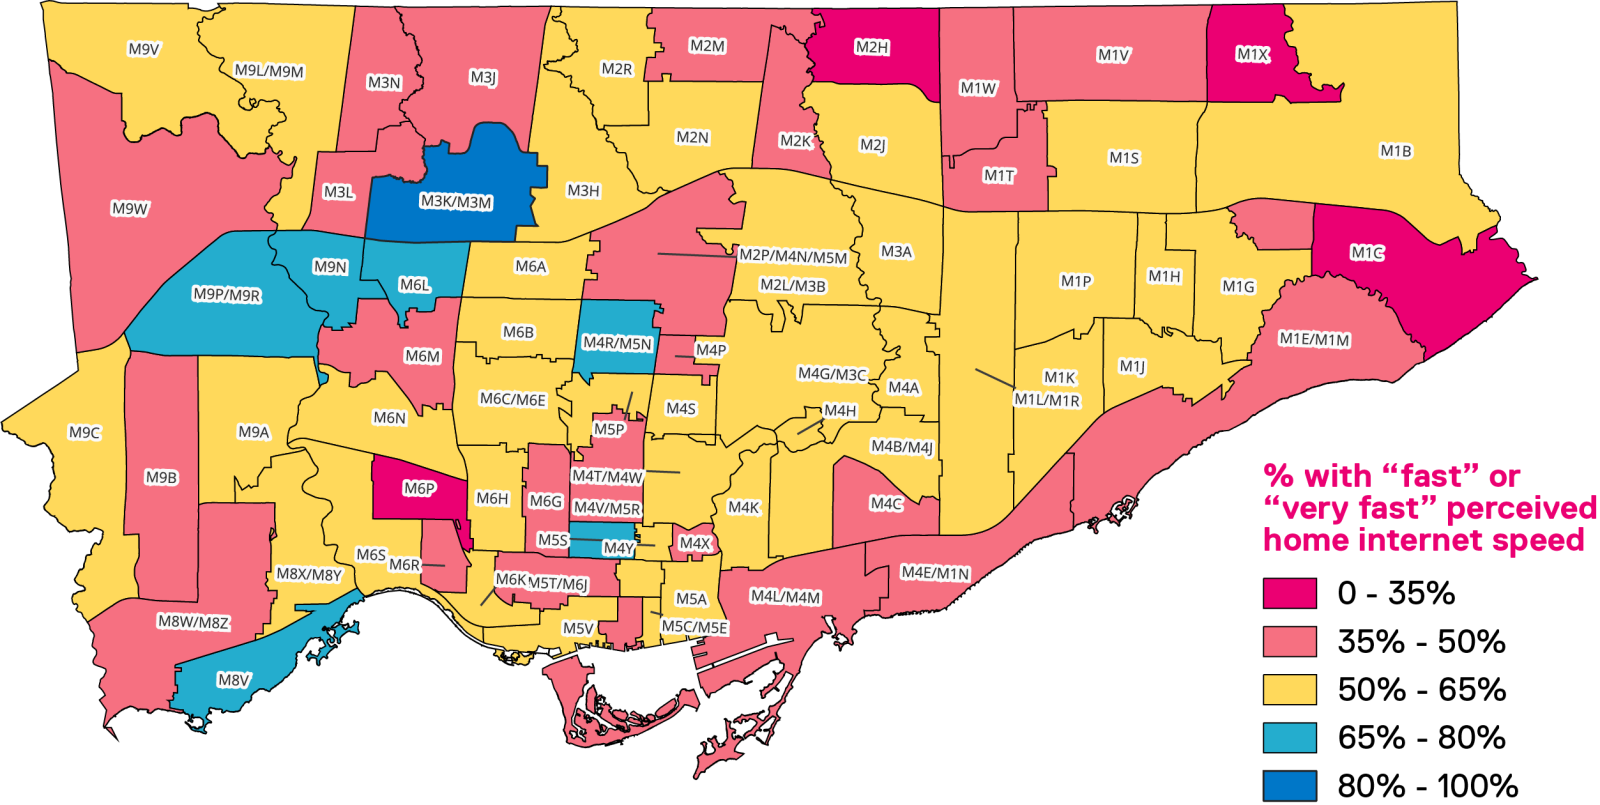
Figure 10
In recent years, Toronto has experienced growth in alternate internet providers, giving residents options for their home internet beyond incumbents Bell and Rogers. While so far the growth has largely been in copper based third party offerings, the CRTC is actively engaged in efforts to increase access to third party fibre offerings.15
While, according to our survey, 79% of Toronto residents use either Bell or Rogers, that leaves 21% who use a different provider. The appeal of these alternate providers is generally that they offer lower cost services: 48% of those with an alternate provider report paying under $110 a month, compared to only 37% of those who use either Bell or Rogers. And, while a quarter of those with Bell or Rogers internet service report paying more than $150 a month, only 12% of those using a third-party provider pay as much.
However, that discount tends to come with slower home internet speeds. While 61% of those with either Rogers or Bell as their internet service provider say they have high-speed internet, only 48% of those with a different provider say the same. Similarly, only 44% of those with an alternate provider describe their internet as fast or very fast. That said, those using alternate internet service providers still believe their internet speeds are adequate, with only 5% describing their internet as slow.
Table 7
Internet Service Provider by Household Income
| Household Income | Less than $30,000 | $30,000 to less than $50,000 | $50,000 to less than $70,000 | $70,000 to less than $100,000 | $100,000 or more | |
|---|---|---|---|---|---|---|
| Internet Provider | Bell | 31% | 32% | 38% | 39% | 39% |
| Rogers | 44% | 47% | 42% | 38% | 43% | |
| Another provider | 21% | 20% | 19% | 22% | 18% | |
| Don't know or prefer not to say | 4% | 1% | 1% | 1% | 0% |
Of course, having sufficient devices capable of accessing the internet is necessary for home internet access. The average Toronto household has 2.1 smartphones, 2.0 laptops, and 1.1 tablets, for a total of more than five devices per household. Accounting for the number of adults in a household, the average household has 2.6 internet-capable devices per adult: 1.0 cellphone, 1.0 laptop, and 0.6 tablets.
Those aged 65 and older have the lowest average number of devices per adult in their household (at only 2.4), compared to the highest device count cohort between 45 and 54 (an average of 2.9). A large portion of this difference comes from smartphones — on average, those aged 65 and older are the only group with fewer than one smartphone in their household (0.8). This is driven by 12% of those aged 65 and older saying they do not have a smartphone, compared to 2% of those under 65. By comparison, in 2020, 20% of those aged 60 and older said they do not have a smartphone.
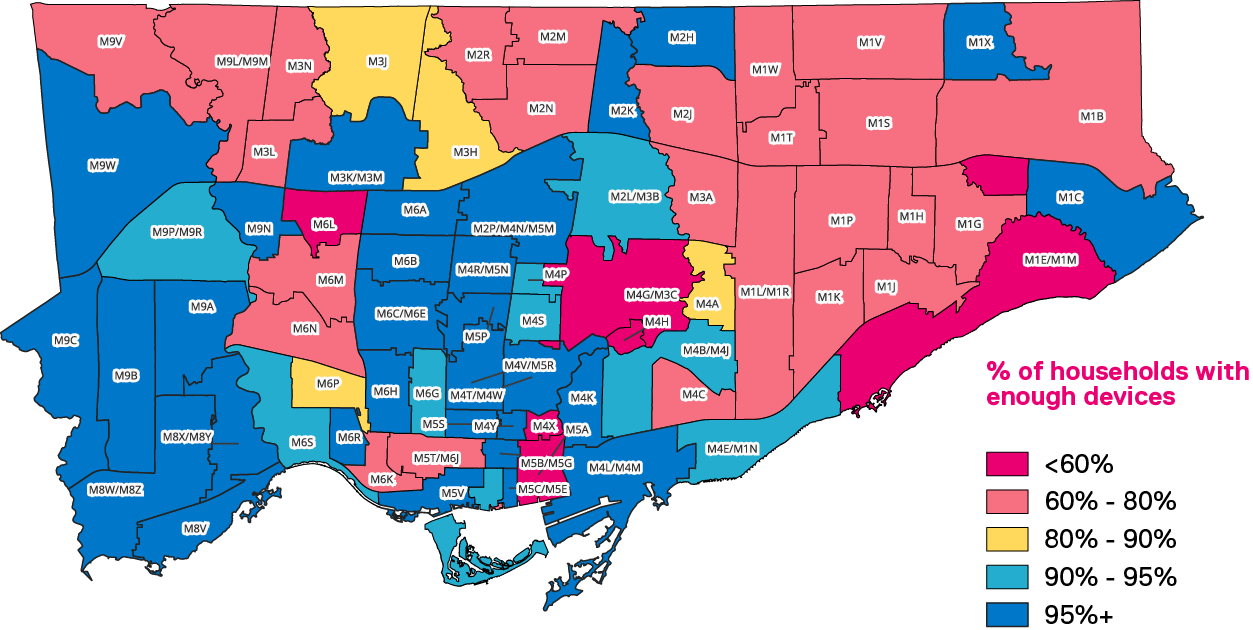
As with overall connectivity, across all demographic groups nearly all Toronto residents believe they have enough internet-capable devices in their home to meet their day-to-day needs. Overall, 95% of households say they have enough devices. However, again there are still significant differences across groups. Importantly, the number of these devices in a household per adult has a significant impact on perceptions of whether there are enough — households that have fewer than one internet-capable device per adult are less likely than other households to feel their needs are met.
Table 8
Access to Sufficient Devices by Number of Device in the Household
| <1 Device Per Person | 1 to <2 Devices Per Person | 2+ Devices Per Person | ||
|---|---|---|---|---|
| Enough Devices in the House | Yes | 91% | 94% | 98% |
| No | 6% | 4% | 2% | |
| Didn't answer | 3% | 2% | 1% |
Households with kids are slightly more likely to feel they do not have access to enough devices. While 97% of households with two or more adults and no children under 18 say they have enough devices, 95% of households with either young kids (under the age of 12) or teenage kids (13 to 17) say they have access to enough devices.
Table 9
Devices Access by Household Income
| Household Income | Less than $30,000 | $30,000 to less than $50,000 | $50,000 to less than $70,000 | $70,000 to less than $100,000 | $100,000 or more |
|---|---|---|---|---|---|
| Devices Per Person | 2.44 | 2.44 | 2.75 | 2.67 | 2.82 |
| % with enough devices | 92% | 95% | 95% | 97% | 99% |
Figure 11
In recent years, the issue of affordability has quickly become one of the most prominent issues in Toronto. With the cost of everything from food to housing increasing, the already high costs of broadband internet in Canada risk becoming an even greater issue.
Combined Bills
This year, to better assess internet and cell phone costs, we adjusted the survey instrument to ask respondents with combined internet and phone bills about their combined monthly bill rather than asking them to estimate the share of each. The analysis here presents both the results of the individual bills among those who receive separate bills and the results of combined bills for every respondent.
In order to create a combined bill for respondents who received two separate bills, we used the mid-point in each range as an estimate of the actual amount a bill cost for residents. Then, the two separate bills were combined to find a bundled cost.

A majority of Toronto residents report paying at least $110 a month for their combined home internet and cell phone bills, with 21% reporting that they pay more than $150 a month for these services.
Table 10
Cost of Home Internet and Cell Phone Service
| Household Income | Less than $30,000 | $30,000 to less than $50,000 | $50,000 to less than $70,000 | $70,000 to less than $100,000 | $100,000 or more | |
|---|---|---|---|---|---|---|
| Cost of Home Internet and Cell Phones | $40 or less | 8% | 3% | 3% | 2% | 2% |
| Between $41 and $79 | 26% | 22% | 16% | 13% | 9% | |
| Between $80 and $109 | 22% | 20% | 27% | 22% | 18% | |
| Between $110 and $149 | 23% | 35% | 31% | 39% | 36% | |
| More than $150 | 12% | 14% | 17% | 22% | 32% | |
| Don't know or prefer not to say | 10% | 5% | 6% | 2% | 3% |
Among those who pay separate bills, 74% of residents report paying at least $50 a month for their home internet, and 53% report paying at least $50 a month for their cell phones. Only 18% of respondents report paying less than $50 a month for home internet, and 45% report paying less than $50 for their cell phones.
As expected, there is a relationship between the cost of home internet and cell services, and the actual internet speed that Toronto residents get (0.28 correlation coefficient). However, the correlation is much weaker when comparing the cost of these services and perceived internet adequacy (0.10).
Households with the highest incomes tend to spend more on their combined internet and cell phone bills. Among households that made $100,000 or more, 68% report spending more than $110 a month on these services, compared to only 35% of households making under $30,000. Lower-income houses making under $30,000 instead tend to opt for the cheaper available options — more than a third of households in this group manage to spend under $80 combined on their cell phone and home internet.
Table 11 shows the share of income households spend on home internet and cell phone service at different monthly costs and different income levels. Notably, for those in the lowest income group, spending even $40 a month on these services is nearly the same share of their income as those in the highest income group spending $150 a month.
Table 11
% of Income Spent on Internet and Cell Phone
| Annual Household Income | $30,000 | $50,000 | $70,000 | $100,000 | |
|---|---|---|---|---|---|
| Monthly cost of home internet and cell phone | $40 a month | 1.6% | 1.0% | 0.7% | 0.5% |
| $80 a month | 3.2% | 1.9% | 1.4% | 1.0% | |
| $110 a month | 4.4% | 2.6% | 1.9% | 1.3% | |
| $150 a month | 6.0% | 3.6% | 2.6% | 1.8% |
Table 12
Estimated % of Income Spent on Internet Connectivity by Income Bracket
| Annual Household Income | Less than $30,000 | $30,000 to less than $50,000 | $50,000 to less than $70,000 | $70,000 to less than $100,000 | $100,000 or more |
|---|---|---|---|---|---|
| Estimated Average Income | $15,000 | $40,000 | $60,000 | $85,000 | $100,000 |
| Estimated Average Monthly Bill | $94.51 | $105.64 | $108.14 | $115.10 | $121.34 |
| % of Income | 8% | 3% | 2% | 2% | 1% |
Bills are also typically higher for those living in houses compared to other types of dwellings. Nearly three in ten (27%) of those living in houses report paying more than $150 across services, compared to only 19% of those living in apartment buildings under 10 stories, and 18% of those living in larger apartment buildings.
Toronto and Canada have existing programs that support lower-income households with the high cost of accessing the internet. As mentioned previously, the federal government provides low-income households with access to discounted home broadband. In total, 4% of Toronto residents have a home internet plan that costs them $20 a month or less, the current cost of these discounted plans.

Table 13
Cost of Home Internet and Cell Phone Service by Household Income
| Household Income | Less than $30,000 | $30,000 to less than $50,000 | $50,000 to less than $70,000 | $70,000 to less than $100,000 | $100,000 or more | |
|---|---|---|---|---|---|---|
| Concern About Paying Different Bills | Worry a lot - Home Internet | 21% | 18% | 12% | 14% | 6% |
| Worry a lot - Cell Phone | 21% | 17% | 13% | 12% | 6% | |
| Worry a lot - Bundled | 30% | 20% | 15% | 16% | 13% |
These prices lead to some residents feeling concerned about paying their bills — of those with a home internet bill or a cell phone bill, 13% worry a lot about paying it. Among those who have a single bundled bill, 17% worry a lot about paying it. Overall, these findings are largely stable since 2020, possibly because, although cost of living has been rising, the average cost of home internet has fallen slightly over that period.16
As would be expected, concern about paying phone and internet bills is far higher in lower-income households. More than one in five households making under $30,000 worry a lot about paying both bills. Additionally, those living with disabilities are also more likely to be concerned about paying their bills; for those with a home internet bill, 18% are worried about paying it, compared to only 10% of those not living with a disability.
Figure 14
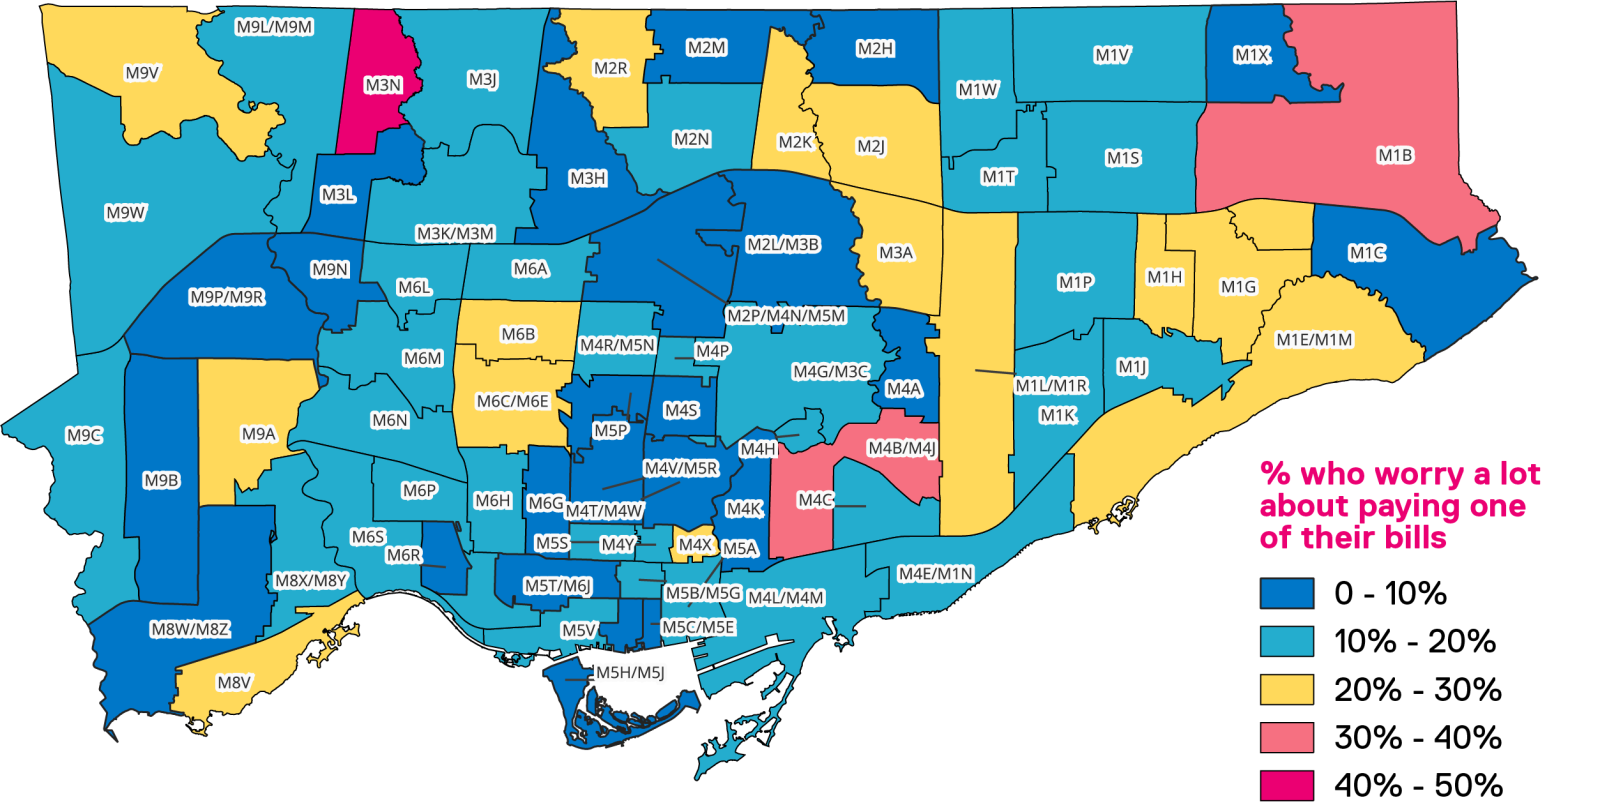
The cost of a cell phone or home internet plan is not the only cost that Toronto residents experience with respect to digital access. There are a myriad of ways that residents can be charged fees, including late bill payments or data overages (both for home internet and for cell phone data).

Table 14
Additional Fees Charged by Household Income
| Household Income | Less than $30,000 | $30,000 to less than $50,000 | $50,000 to less than $70,000 | $70,000 to less than $100,000 | $100,000 or more | |
|---|---|---|---|---|---|---|
| Fees Charged | Been charged late fees for not paying your home internet or cell phone bill on tim | 24% | 24% | 19% | 16% | 13% |
| Been disconnected from home internet or cell phone service due to lack of payment | 17% | 15% | 9% | 9% | 5% | |
| Been charged fees for going over data limits or caps on your cell phone | 24% | 26% | 22% | 24% | 24% | |
| Been charged fees for going over data limits or caps on your home internet | 11% | 14% | 9% | 12% | 11% | |
| None of the above | 47% | 46% | 57% | 57% | 62% | |
| Don't know or prefer not to say | 5% | 3% | 2% | 2% | 2% |
Overall, four in ten residents say they have been either charged an additional fee for their home internet or cell data, or have had it disconnected because they did not pay their bill on time. The most common of these is paying a fee for cell phone data overages: 23% of residents say they have been charged for this.
These impacts are particularly concentrated among younger Torontonians and newcomers to Canada. A majority of those who have been in Canada for less than 10 years (51%) say they have been charged a fee or had their internet disconnected, and similarly 50% of those under 35 have experienced the same. In particular, these groups are also most likely to have had their home internet disconnected because they did not pay their bill on time.
Between home internet and cell phone data overage fees, 28% of households experience either one or the other. Among those who paid these fees, most have paid a modest amount over the last 12 months — 40% say they have been charged less than $25 in the last year. However, some are paying significantly more, with 8% of respondents saying they spent more than $100 in the last year.

Table 15
Data Overage Fees Paid by Household Income
| Household Income | Less than $30,000 | $30,000 to less than $50,000 | $50,000 to less than $70,000 | $70,000 to less than $100,000 | $100,000 or more | |
|---|---|---|---|---|---|---|
| Total Data Overage Fees Paid | $0-24 | 35% | 38% | 39% | 39% | 47% |
| $25-49 | 16% | 18% | 21% | 20% | 21% | |
| $50-74 | 24% | 22% | 21% | 11% | 11% | |
| $75-99 | 8% | 7% | 10% | 9% | 7% | |
| $100 or more | 8% | 7% | 5% | 12% | 8% | |
| Don't know or prefer not to say | 9% | 9% | 4% | 9% | 6% |
1
Statistics Canada, “Stats in Brief: Canadian Internet Use Survey, 2022,” The Daily, July 20, 2023, https://www150.statcan.gc.ca/n1/daily-quotidien/230720/dq230720b-eng.htm
2
Canadian Radio-television and Telecommunications Commission. Telecom Regulatory Policy CRTC 2016-496. Ottawa, December 21, 2016. https://crtc.gc.ca/eng/archive/2016/2016-496.htm
3
City of Toronto, “ConnectTO: Internet Connectivity,” https://www.toronto.ca/city-government/accountability-operations-customer-service/long-term-vision-plans-and-strategies/smart-cityto/internet-connectivity-connectto/
4
Sam Andrey and Nour Abdelaal, “Towards a Digital Equity Policy for the City of Toronto,” The Ryerson Leadership Lab, March 2022, https://dais.ca/reports/digital-equity-in-the-city-of-toronto/
5
Helen Hambly and Reza Rajabiun, “Rural broadband: Gaps, maps and challenges,” Telematics and Informatics 60 (2021), https://doi.org/10.1016/j.tele.2021.101565
6
Alexander JAM van Deursen and Jan AGM Van Dijk, “The first-level digital divide shifts from inequalities in physical access to inequalities in material access,” New Media & Society 21 no. 2 (2019): 345-375,
https://doi-org/10.1177/1461444818797082
7
Rogers, “Rogers Connected for Success,” https://about.rogers.com/our-impact/rogers-connected-for-success
8
Toronto Public Library, “Free Internet Connectivity Kits from the Library provide vital connection for some of Toronto’s most vulnerable residents,” https://torontopubliclibrary.typepad.com/news_releases/2020/05/free-internet-connectivity-kits-from-the-library-provide-vital-connection-for-some-of-torontos-most-.html
9
Najeh Aissaoui, “The digital divide: a literature review and some directions for future research in light of COVID-19,” Global Knowledge, Memory and Communication 71 no. 8/9 (2022): 686:708, https://doi.org/10.1108/GKMC-06-2020-0075
10
Sam Andrey and Nour Abdelaal, “Towards a Digital Equity Policy for the City of Toronto,” The Ryerson Leadership Lab, March 2022, https://dais.ca/reports/digital-equity-in-the-city-of-toronto/
11
Najeh Aissaoui, “The digital divide: a literature review and some directions for future research in light of COVID-19,” Global Knowledge, Memory and Communication 71 no. 8/9 (2022): 686:708, https://doi.org/10.1108/GKMC-06-2020-0075
12
Canadian Radio-television and Telecommunications Commission, 2016.
13
Innovation, Science and Economic Development Canada, “High-speed Internet for all Canadians,” https://ised-isde.canada.ca/site/high-speed-internet-canada/en
14
Cable.co.uk, “World broadband speed league 2023”, https://www.cable.co.uk/broadband/speed/worldwide-speed-league/
15
Canadian Radio-television and Telecommunications Commission, “CRTC takes action to increase choice and affordability of high-speed Internet”, November 6, 2023, https://www.newswire.ca/news-releases/crtc-takes-action-to-increase-choice-and-affordability-of-high-speed-internet-866041290.html
16
Statistics Canada, “Consumer Price Index, December 2023,” The Daily, January 16, 2024, https://www150.statcan.gc.ca/n1/daily-quotidien/240116/dq240116a-eng.htm