Funded by

Authors

Angus Lockhart

Mahtab Laghaei

Sam Andrey
Contributors
- Nina Rafeek Dow
- Mariana Rodrigues
- Suzanne Bowness
- Sultan Balarabe
- Zaynab Choudhry
August 2024

Angus Lockhart
Mahtab Laghaei
Sam Andrey
Bold idea: As new AI tools fuel the spread of online hate and misinformation corrosive to our democracy and shared citizenship, most Canadians support government intervention to mitigate online harms.
Information is moving at fast and furious speeds. The proliferation of social media platforms, instant messaging and digitization of news media has moved the “public square” online, where a thought, a video, or a photo can be shared with anyone, and anywhere, instantly.
For many, this is a good thing. Marginalized peoples, for example, have platforms where they can share their voices and stories unencumbered. However, these innovations have also enabled ill-intentioned actors to weaponize these same platforms, manipulating the algorithms to spread conspiracy theories and extremism, and to target vulnerable people with hate and harassment.
For most, this is nothing new. What has changed, though, is the onset of new and sophisticated artificial intelligence (AI) based technologies, which lower the skills barrier to creating realistic-looking fake media. A video may no longer be a source of truth. A picture may no longer be worth a thousand words.
We are squarely in the age of disinformation—where Canadians are increasingly exposed to deepfakes and politicized content generated from foreign disinformation campaigns, conspiracy theories that are synthetically legitimized, non-consensual and predatory imagery, and hateful content.
How can we protect the health and safety of people in Canada while upholding the rights and freedoms granted to us by the Charter? What support do people need to navigate the complexities of this evolving digital landscape? One thing is clear: Canadians are ready for the government to step in and take action. Our latest survey shows that support for government action has increased.
The Survey of Online Harms in Canada 2024 is the fifth report of its kind and the first since Canada’s proposed Online Harms Act was tabled. Similar to our previous publications, this report provides up-to-date insights on Canadian residents’ experiences with harmful online content, and their views on the role of government and platforms in addressing those harms.
This online survey was conducted in April 2024 with a representative sample of 2,500 Canadian residents aged 16 and older.
Social media use
News sources
Trust in platforms and news
Exposure to online harms
Deepfakes
Personal experience with online harms
Belief in misinformation
Attitudes about government intervention
TikTok ban
We asked respondents which online platforms they use and how often they use them. When it comes to habitual platform use (those who use a platform at least a few times a day), Meta-owned platforms are the most used, with more than half saying they use Facebook every day and more than one-third using Messenger (Facebook’s messaging app) and Instagram. The only other platform that sees as many daily users is YouTube with 34 percent of respondents using it at least a few times a day. However, looking at overall platform usage regardless of frequency, YouTube is the most used — only seven percent of respondents say they never use YouTube with a large group using it either a few times a week (28 percent) or a few times a month (20 percent).
Figure 1 - Frequency of use of online platforms in Canada
Caption: "Which of the following best describes how often you typically use the following online platforms:”
Instagram has continued its growth pattern. In 2019, only 48 percent said they use Instagram. In 2022, that rose to 55 percent and now it has risen to 62 percent (+14 percent). Similarly, WhatsApp use rose from 34 percent in 2019 to 46 percent in 2024 (+12). The biggest growth, however, has been by TikTok: in 2019, only 10 percent of Canadian residents reported using this video platform, which increased to 29 percent in 2022 and now is at 34 percent or more than one-third of respondents (+24 percent).
Figure 2 - Overall change in use of online platforms in Canada
Caption: "Which of the following best describes how often you typically use the following online platforms:” % who use each platform at least a few times a year.
The only platform that has seen a significant decline in usage is Twitter/X, which has declined from being used by 44 percent of people living in Canada to only 33 percent of residents now (-11; with only 10 percent saying they use it at least daily, compared to 19 percent in 2019).
For nearly every platform, the youngest cohort is the most likely to be habitual users — 72 percent of those aged 16 to 29 use Instagram daily, 51 percent use YouTube daily, 45 percent use Snapchat daily, and 39 percent use TikTok daily. For all of these platforms, habitual usage declines with age. That decline is most significant for Snapchat where only 12 percent of those aged 30 to 44 use Snapchat daily and less than two percent of those over 44 use it daily.
Figure 3 - Daily platform use by age group
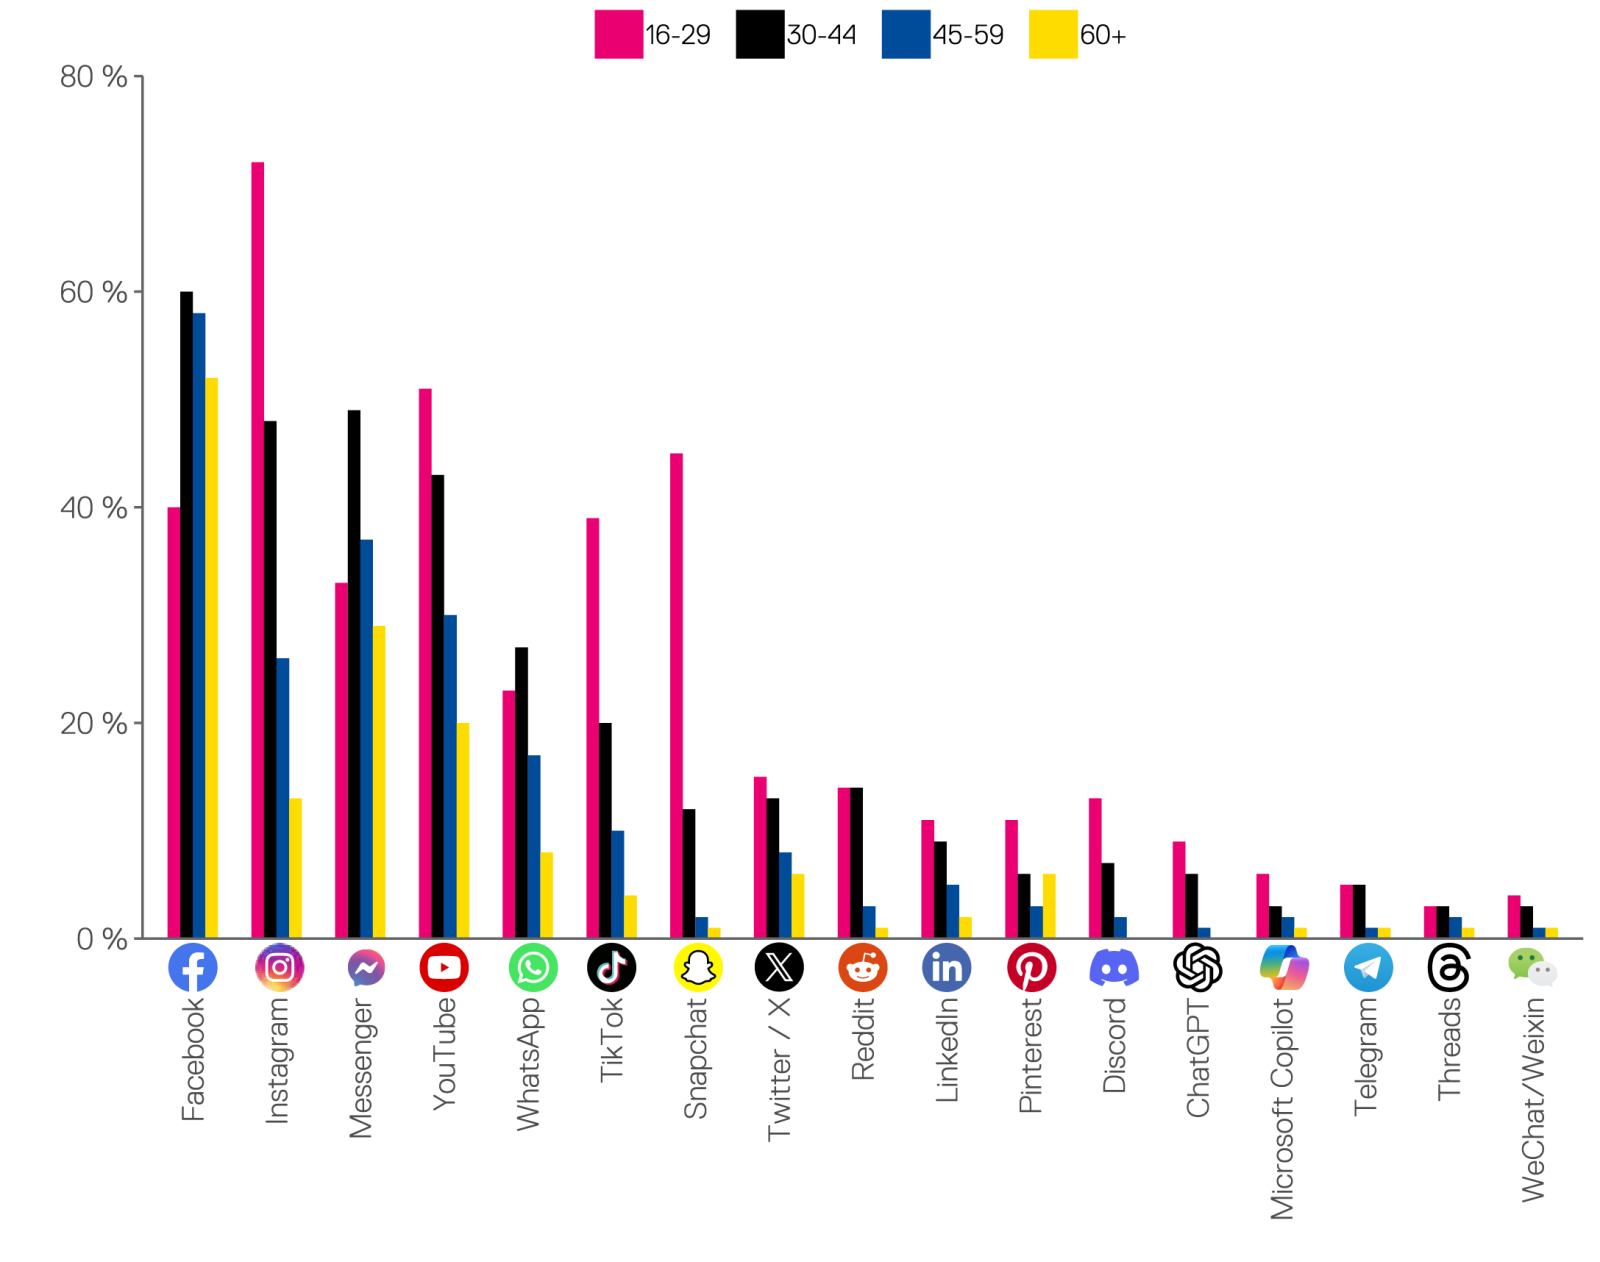
Caption: "Which of the following best describes how often you typically use the following online platforms:” - % who use each platform at least a few times a day.
While the youngest group is far more likely to use YouTube habitually (51 percent of those under 30 use it daily, compared to only 20 percent of those over 60), total usage of the platform is consistent across groups. More than 90 percent of those under 60 report ever using YouTube, and similarly, 87 percent of those 60 and over say they have ever used YouTube.
However, both Facebook and Messenger do not follow the same pattern. For these platforms, those 30 to 44 (a cohort that includes most Millennials) are the most likely to use the platform with 60 percent using Facebook daily and 49 percent using Messenger daily.
While those living in Canada continue to use social media more and more, many still turn to more traditional news sources. News on TV, news websites, and news on the radio are the top three sources that Canadian residents say they use to stay up to date with news and current events, followed closely by search engines which will often lead to news websites.
Figure 4 - Most common news sources in Canada

Caption: “Which of the following do you use to stay up to date with the news or current events?”
After these sources, Facebook, YouTube, and Instagram are common news sources. While Facebook remains the top social media platform for news (27 percent), it has declined since 2022. Among those who use the platform at all, six percent fewer now report using Facebook as a source to stay up to date on the news — potentially in response to the Online News Act, which we discuss in detail below. However, other social media platforms are now more heavily used as a source of news: among only those who use the platforms, six percent more report using TikTok than in 2022 and four percent more report using Instagram for news. This is growth beyond simply growth in the share of residents using these platforms at all.
Figure 5 - Most common news sources in Canada over time

Caption: “Which of the following do you use to stay up to date with the news or current events?”
Figure 6 - Use of news sources by age in Canada

Caption: “Which of the following do you use to stay up to date with the news or current events?”
Looking at these figures across the population as a whole masks significant differences by age. Younger people rely on dramatically different sources of information than older cohorts. While “news on TV” is the top source of information for those aged 60+ (78 percent using it for news) and those 45 to 59 (61 percent using it for news), only 39 percent of those aged 30 to 44 use TV for news and only 37 percent of those under 30 watch news on TV.
For those under 30, Instagram is the number one source of news and current events: 46 percent say they use it for news. Instagram is followed by search engines (42 percent), TV news (37 percent), news websites (36 percent), YouTube (35 percent), and TikTok (28 percent). TikTok in particular has grown as a news source from 21 percent of those aged 16 to 29 in 2022 (including 32 percent of those 23 and under).
The age differences are most significant for print newspapers. While one-third (33 percent) of the oldest cohort say they use print news to stay current, readership declines dramatically with age. Even among those aged 45 to 59, only 14 percent read print newspapers and among the youngest group only six percent read print news.
Overall, while the oldest Canadians continue to rely heavily on traditional print and TV news, younger Canadians have largely switched to digital news sources — either news websites or, for the youngest, social media.
Figure 7 - Most and least trusted news sources (among users of each source)

Caption: "Which of these would you say you trust the [most/least] for staying up to date with the news or current events?”
Despite the rise of social media as a news source, traditional news delivered on TV, on news websites, and on the radio remain the most trusted source of information, collectively accounting for more than half of Canadians' most trusted news sources.
When asked which news source they trust the least (among only news sources they actively use), most report that there are no news sources that they don’t trust. This suggests that Canadians are avoiding news that they have already deemed not trustworthy. However, for those who did pick a specific source, Facebook was the most distrusted source at 12 percent.
Figure 8 - Perceived impact of Meta’s decision to block news in Canada

Caption: “In response to legislation from the federal government that would require online platforms to compensate news organizations for posting links to news articles, Meta decided to block Canadian news on both Facebook and Instagram. Our survey question asked: To what extent has Meta’s decision to block Canadian news on Facebook and Instagram impacted your ability to stay up to date with the news or current events?”
This distrust is in the shadow of the decision by Meta (in response to the Online News Act from the federal government designed to compensate news organizations) to block Canadian news on both Facebook and Instagram. The majority of respondents felt that this has had no impact on their ability to stay current with the news, but 41 percent say that it has had a negative impact including 15 percent who say it has had a very negative impact.
The most common ways that Canadian residents are actively engaging online are by fact-checking information and commenting on or posting about news and politics. Two-thirds of respondents say they have fact-checked something they saw online using a different source, higher among younger respondents (70 percent of those under 30, and 73 percent of those 30 to 44). The largest difference in fact-checking is across the self-identified political spectrum4 — 82 percent of those who say they are on the left also say they have fact-checked something, while 53 percent of those who say they are on the right have done the same.
Figure 9 - Frequency of digital civic participation in Canada

Caption: "Have you ever experienced any of the following?”
When it comes to commenting or posting online about news or politics, 31 percent say they have ever done it, with men (35 percent) being more likely than women (27 percent) to have posted. Similarly, respondents with higher education levels were more likely to say they have commented or posted about news or politics online — 34 percent of those with a university degree have done so, compared to 25 percent of those with a high school education or less.
Other forms of engagement are less common. Just under two in five (18 percent) say they have joined an online group about an issue with people that they do not know. The two groups most likely to be in an online group are respondents living with a disability (31 percent) and 2SLGBTQ+ (33 percent) respondents. There is a sharp divide in this kind of participation between those over and under the age of 60. Under the age of 60, about one in five Canadian residents say they have joined an online group — consistent across age cohorts. However, among those 60 and older only 11 percent have done so.
Another 13 percent have participated in a government or political consultation online — with men (18 percent) being more than twice as likely as women (eight percent) to say they have done so. Participation in government consultations is closely tied to education — among those with a university education, 20 percent say they have done so, while only seven percent of those with a high school education or less have.
Finally, 13 percent of Canadian residents say they have paid for a digital news subscription. The federal government offers a Digital News Subscription Tax Credit and according to information from the Canadian Revenue Agency, just over 300,000 Canadians filed for the credit in 2020.5 This is similar to the 13 percent who reported a digital news subscription in 2024, although the tax credit is only available for paid subscriptions to qualified Canadian journalism organizations. Unsurprisingly, paid digital news subscriptions are most common among households earning the most: 21 percent of those with a household income over $100,000 have paid for a digital news subscription.
Trust in Canadian news organizations to act in the best interest of the public has largely stabilized after falling slightly in 2022. We asked participants how much trust they had in a number of different companies to act in the public interest, including major news organizations, social media platforms and digital service providers, alongside other major Canadian companies for additional context. The four most trusted companies tested to act in the public interest were CBC, Canadian Tire, CTV, and Global News, all had more than 40 percent of respondents say they trust them at least a 7 out of 9. Looking specifically at CBC / Radio-Canada, trust has been steady since 2022 with 48 percent saying they trust the organization to act in the public interest, and CBC is now the most highly trusted organization tested.
Figure 10 - Trust in organizations to act in the best interest of the public

Caption: “On a scale of 1-9, where 1 means you have no trust at all and 9 means you have a high degree of trust, how do you feel about each of the following companies when it comes to trusting them to act in the best interest of the public:”
Radio-Canada is specifically well trusted in Quebec, where 64 percent of respondents have a high level of trust in the organization. However, trust in CBC in Alberta is particularly low — only 34 percent have a high degree of trust in the organization. Across the board, Alberta tends to have lower levels of trust in news organizations. Only 36 percent highly trust Global News, 34 percent highly trust CTV, and only 21 percent highly trust The Globe and Mail.
For nearly every company tested, those on the right of the political spectrum are more likely than those on the left to trust that they will act in the public interest, reflecting general differences in support for the free market across the political spectrum. In general, the differences are smaller for news organizations but the only company that is more trusted by the left (57 percent) than the right (41 percent) is the CBC. This likely reflects the nature of the CBC as a publicly-funded entity and recent calls by some on the political right to see funding for the CBC decreased or eliminated.
Trust for big tech companies is split — while some are largely trusted, others are not. Google, Microsoft and Apple are all towards the top of the list of big tech companies.
However, social media platforms are much less trusted — Meta, Twitter/X, and TikTok are among the least trusted companies, with a majority of respondents having low (between 1 and 3) trust in them to act in the public interest. These platforms exist in a group of their own at the bottom, with the only other company joining them being the creator of ChatGPT, OpenAI, which, while not well trusted, is also not yet well known. Nearly one-third of respondents still don’t know if they trust OpenAI to act in the interest of the public.
Figure 11 - Trust in social media platforms in Canada over time

Caption: “On a scale of 1-9, where 1 means you have no trust at all and 9 means you have a high degree of trust, how do you feel about each of the following companies when it comes to trusting them to act in the best interest of the public:”
For most companies, trust has been very stable since 2022. The three exceptions are Twitter/X, TikTok and Loblaws, all of which have received significant negative media attention over the past year. For Twitter/X, there has been no change in the share who have a high degree of trust (11 percent in both 2024 and 2022); however, the low trust group has grown from 40 percent in 2022 to 48 percent now. For TikTok, the share with low trust has grown from 50 percent in 2022 to 55 percent. For Loblaws, the change has been more dramatic. In 2022, 34 percent had a high degree of trust in the company. That has since declined to only 25 percent while those with low trust have nearly doubled from 13 percent in 2022 to 25 percent in 2024.
When considering whether people living in Canada trust that providers of digital services will offer secure and responsible platforms, residents have the highest degree of trust in health-care providers with a majority having a high level of trust (at least a 7 on a 9-point scale). Canadian banks are nearly as well trusted: 45 percent say they have a high level of trust in digital services from banks.
Figure 12 - Trust in secure and responsible digital services from each provide

Caption: "You are likely interacting with a number of digital services in your daily life. We want you to consider which sectors you most trust to offer secure and responsible digital services. This means products and services that are modern and reliable, ensure your informed consent, respect your privacy, protect your information from cyber breaches, and are aligned with the public interest.
On a scale of 1-9, where 1 means you have no trust at all and 9 means you have a high degree of trust, how do you feel about each of the following when it comes to trusting them to offer secure and responsible digital services:”
Governments fall squarely in the centre — municipal governments are most trusted at 37 percent, while provincial and federal governments both have 33 percent of people living in Canada saying they trust them to provide digital services securely and responsibly.
The least trusted service providers are cryptocurrency exchanges — more than half have a low level of trust in cryptocurrency exchanges including 29 percent who reported having no trust at all in them. There are significant age differences in trust in crypto exchanges: only 37 percent of those under 30 report having no trust in crypto exchanges compared to 54 percent of those 45 to 59 and 65 percent of those aged 60+. On the flip side, 13 percent of those under 30 report having a high degree of trust in cryptocurrency exchanges.
For all of these service providers, trust has been down since 2022, although in most cases the decline has been small. The largest declines are for the federal government (high trust has declined from 38 to 33 percent, while low trust has grown from 21 percent to 26 percent) and for health-care providers (high trust has declined from 55 percent to 51 percent, although low trust has only grown from 8 percent to 10 percent).
To better understand Canadians’ engagement with online harms and misinformation, it is essential to know which sources Canadians can turn to and trust. For policymakers, strengthening media literacy and better enabling access to trusted information are critical components to mitigate disinformation and online harm. Using a pre-selected set of sources, we asked respondents how much they would trust each if they wanted to learn more about misinformation and digital literacy.
Figure 13 - Trust in different sources for learning about digital literacy and misinformation

Caption: “How much would you trust each of the following sources if you wanted to learn more about misinformation and digital literacy?”
Our survey shows that the majority of Canadian residents trust public libraries (89 percent of overall support), followed by friends and family (83 percent), and their child’s school for those with children under 18 (81 percent, n=647). Though overall support exceeded 60 percent for both, strong trust for news media and the federal government was relatively weak (11 percent and 10 percent). Though our results indicate higher levels of trust than other studies show, lack of strong trust in news media matches a reported long-term decline in Canada.6
Most Canadian residents say they see nearly every type of harm online at least a few times a year. Most commonly, 75 percent of respondents have seen information or news that they suspect was false and 68 percent of people saw information they initially believed was trust about current events, but later turned out to be false. One in three say they see false news multiple times per week, while nine percent of respondents report seeing news they believe to be false a few times a day.
Figure 14 - Frequency of exposure to online harms in Canada

Caption: “Thinking about your use of online platforms, which best describes how often you see the following, including through posts, links, images, or videos:”
Just under two-thirds (63 percent) reported ever seeing hate speech online and similar proportions saw deepfakes (60 percent) or identity fraud/impersonation (58 percent). Hate speech in particular is observed more frequently by respondents with visible minority identities. While 61 percent of White respondents report seeing hate speech online, 71 percent of those with a visible minority have seen it, including 92 percent of Middle Eastern respondents, 75 percent of South Asian respondents and 72 percent of Black respondents. Seeing hate speech is similarly higher for 2SLGBTQ+ respondents (72 percent) and newcomers to Canada who have been here for less than 10 years (73 percent).
The least common harm respondents saw online was the promotion of physical violence, although still 49 percent say they saw it at least a few times a year and 16 percent say they see it more than once a week. Younger respondents were far more likely to have seen it: 61 percent of those under 30 have seen the promotion of violence online, compared to only 43 percent of those over 60, and 20 percent of the youngest group say they see it at least a few times a week. Those with visible minority identities are also more likely to have seen the promotion of violence — 57 percent say they have seen it, compared to only 47 percent of White respondents.
In all cases (with the exception of deepfakes, which was not measured in previous iterations of this survey), exposure to the harmful content has been steady online, with just minor changes. In the case of hate speech and the promotion of violence, this slight decrease represents the continuing of early declines we observed between 2019 and 2022.
Figure 15 - Frequency of exposure to online harms in Canada over time

Caption: “Thinking about your use of online platforms, which best describes how often you see the following, including through posts, links, images, or videos:”
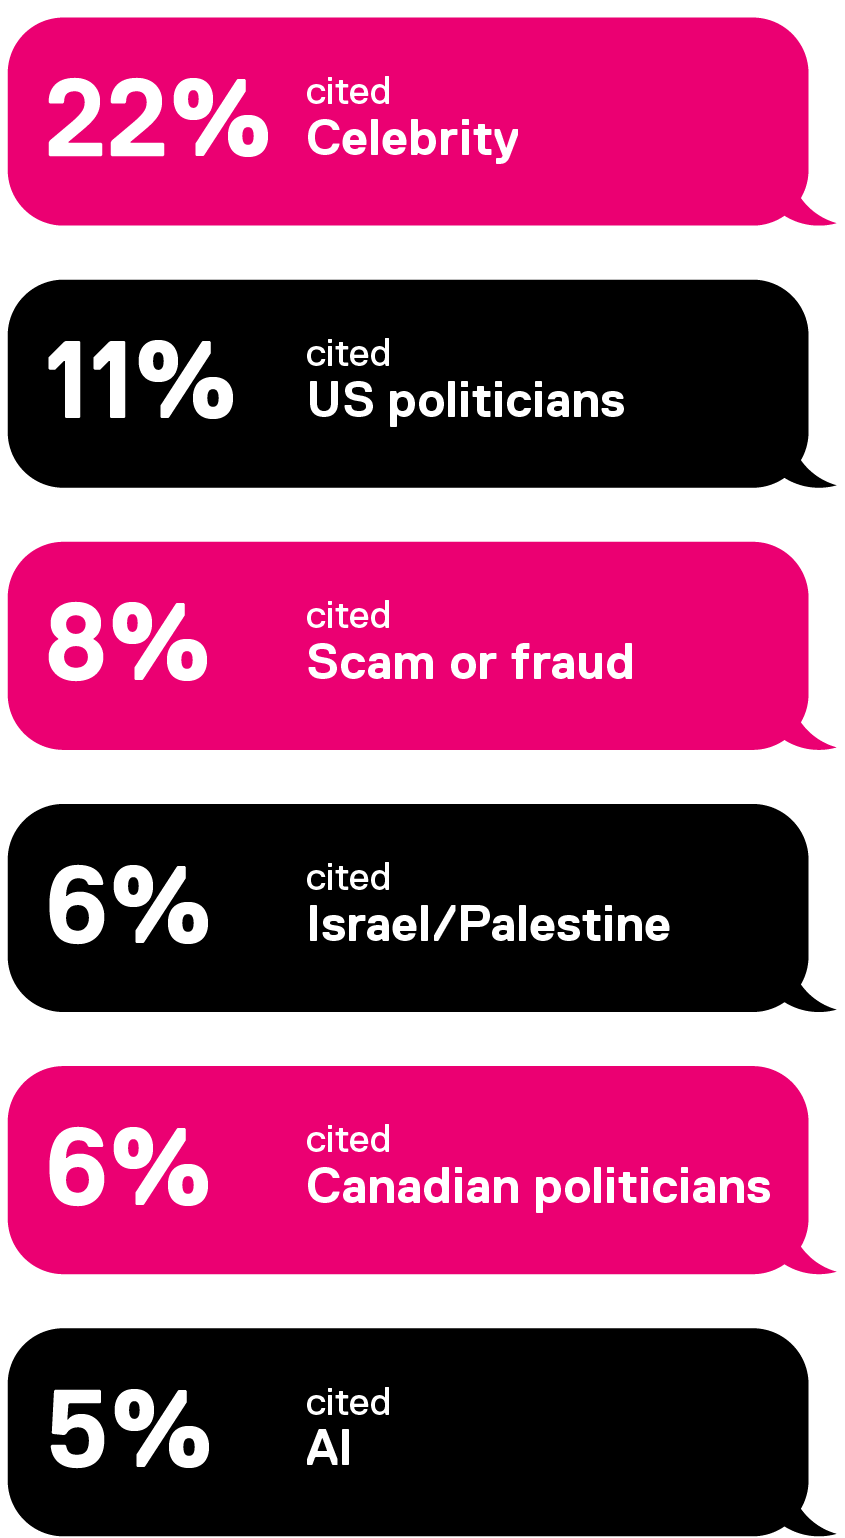
To provide context about these reported levels of overall exposure, we asked those who had seen online misinformation to provide a recent example, which 65 percent provided (n=1,275) and were then coded into categories. Of those that provided an example, the most common response (22 percent) was false news stories about celebrities (e.g., fake deaths, fake product endorsements, fake news about the Royal Family), followed by 11 percent who identified false news stemming from US politicians, particularly Donald Trump. The most common specific topic was misinformation relating to the Israel-Palestine conflict (six percent). Another six percent identified misinformation from Canadian politicians, particularly Prime Minister Justin Trudeau and Leader of the Opposition Pierre Poilievre.
Respondents who had seen online misinformation were asked to provide a recent example of what they saw:
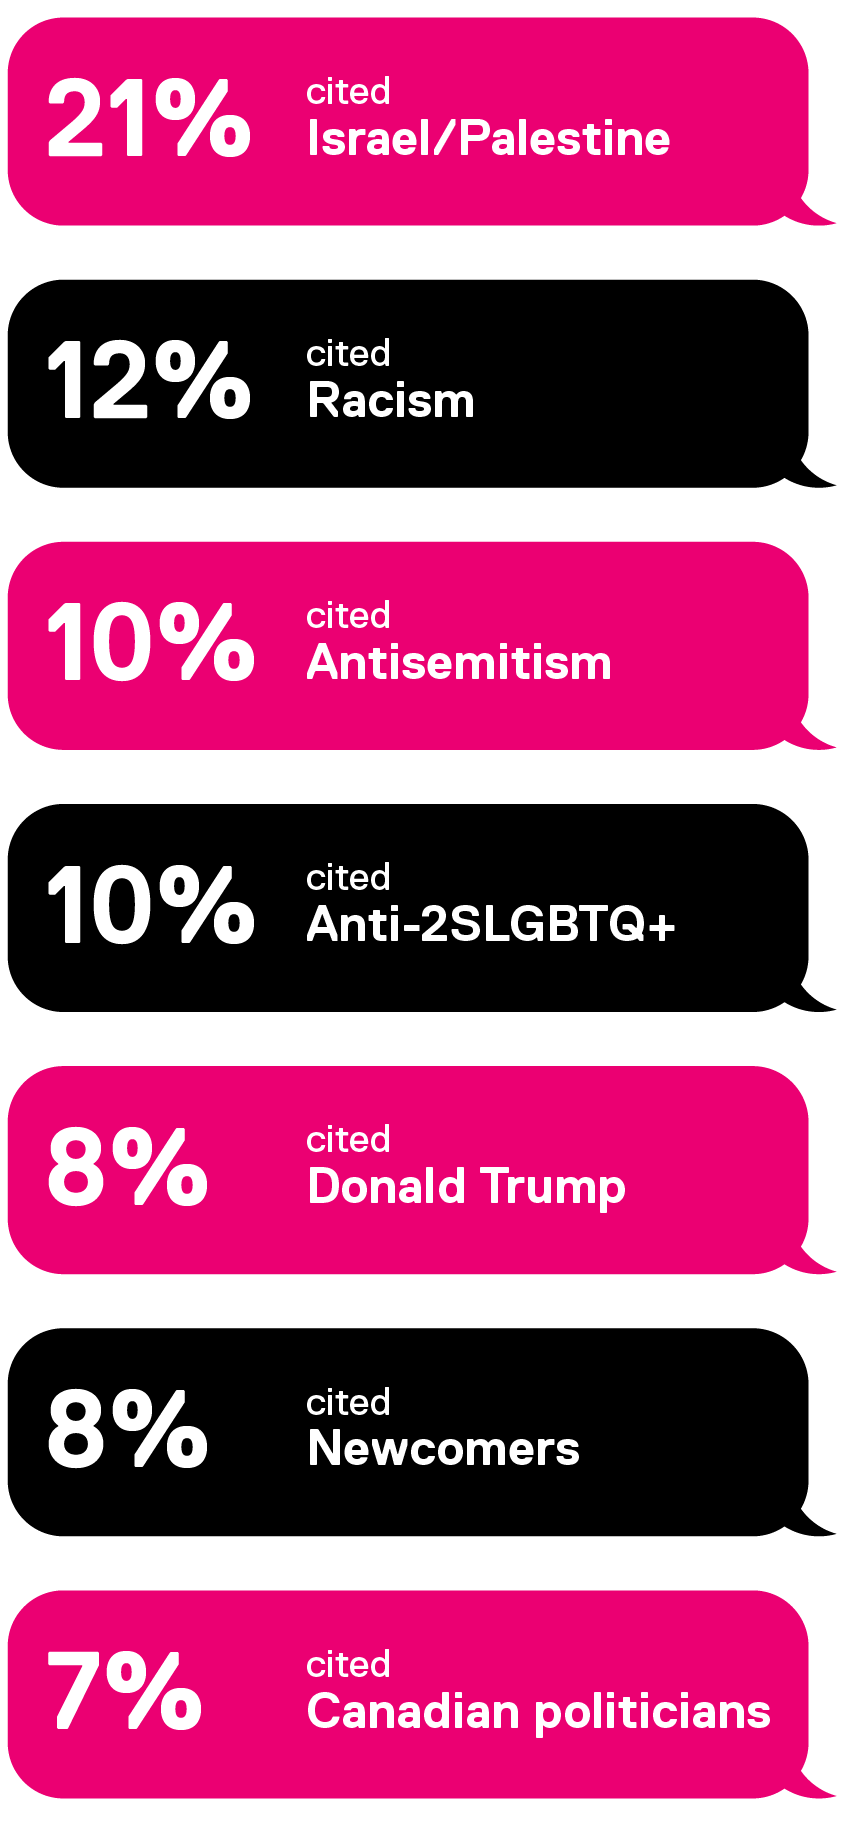
We similarly asked about a recent example of online hate speech, which 60 percent provided (n=928). Hate stemming from the Israel-Palestine conflict was the most common topic (21 percent), followed by examples of racism (12 percent), antisemitism (10 percent) and anti-2SLGBTQ+ hate (10 percent). Hate from Donald Trump (eight percent) and hate targeted to or from Canadian politicians (seven percent) were also common topics.
Respondents who had seen online hate speech were asked to provide a recent example of what they saw:
With the rise of cheap, easy-to-use generative AI tools like Midjourney or DALL-E, most Canadian residents have now seen deepfakes (digitally manipulated images or videos of a person) appear online (60 percent have seen it ever). For many, it’s a regular occurrence: 23 percent report seeing synthetic media at least a few times a week.
Younger respondents are more likely to report they have seen deepfakes: 74 percent of those under 30 say they have seen a deepfake (with 31 percent seeing deepfakes multiple times per week), compared to 49 percent of those over 60 (and only 17 percent of those over 60 see deepfakes at least a few times a week).
Deepfake exposure is correlated with the use of Facebook, YouTube, Twitter/X, TikTok and ChatGPT. Use of these platforms are associated with a higher likelihood in seeing deepfakes and to seeing deepfakes more often.
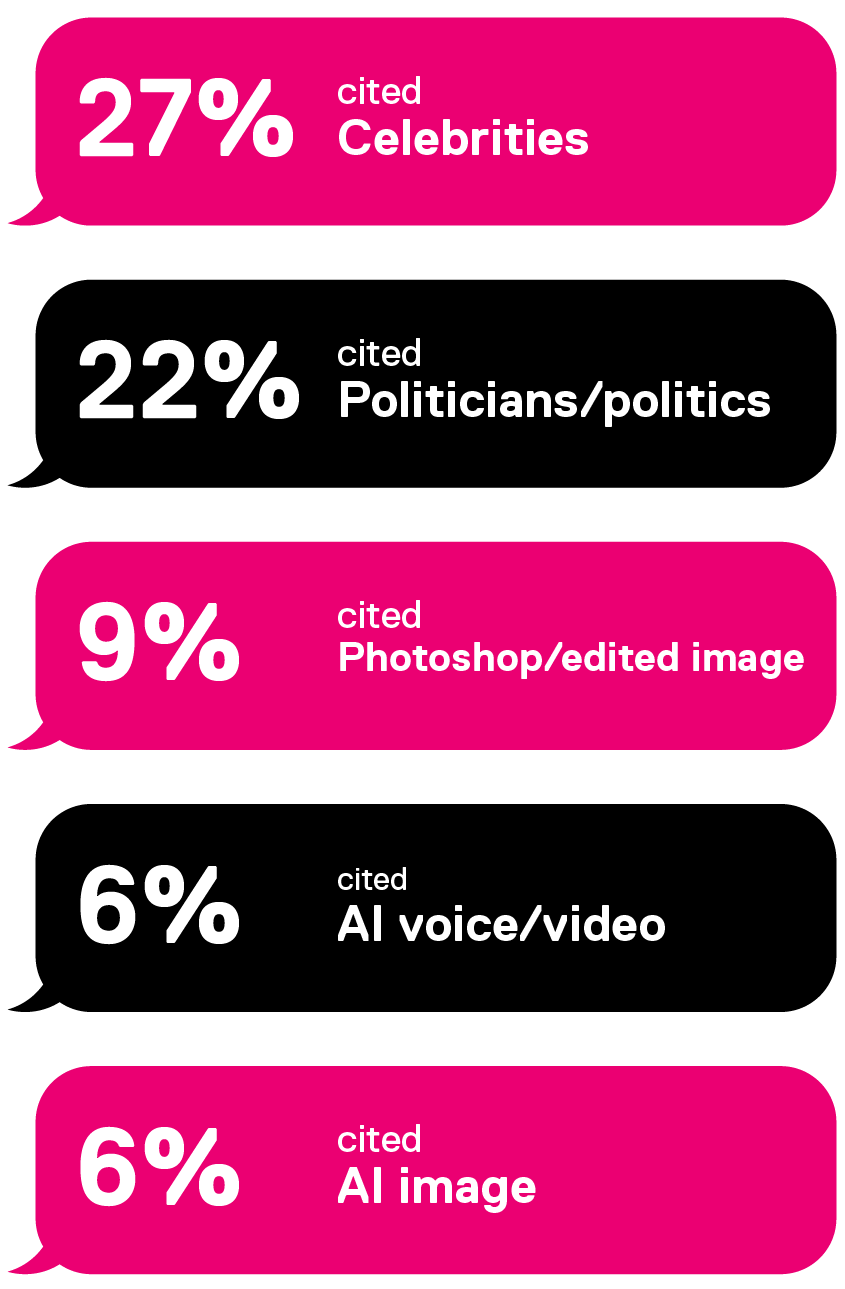
We asked those who said they had seen a deepfake about a recent example, which 59 percent provided (n=867). The most common type of deepfakes reported were generated images or videos of celebrities (27 percent) with political deepfakes close behind (22 percent).
For some, there was confusion between deepfakes and images that were originally genuine but were manually edited through Photoshop or a similar tool. This distinction has also become less and less clear as platforms — including Photoshop itself — have integrated generative AI capabilities into image editing software.
Respondents who had seen synthetic media online were asked to provide a recent example of what they saw:
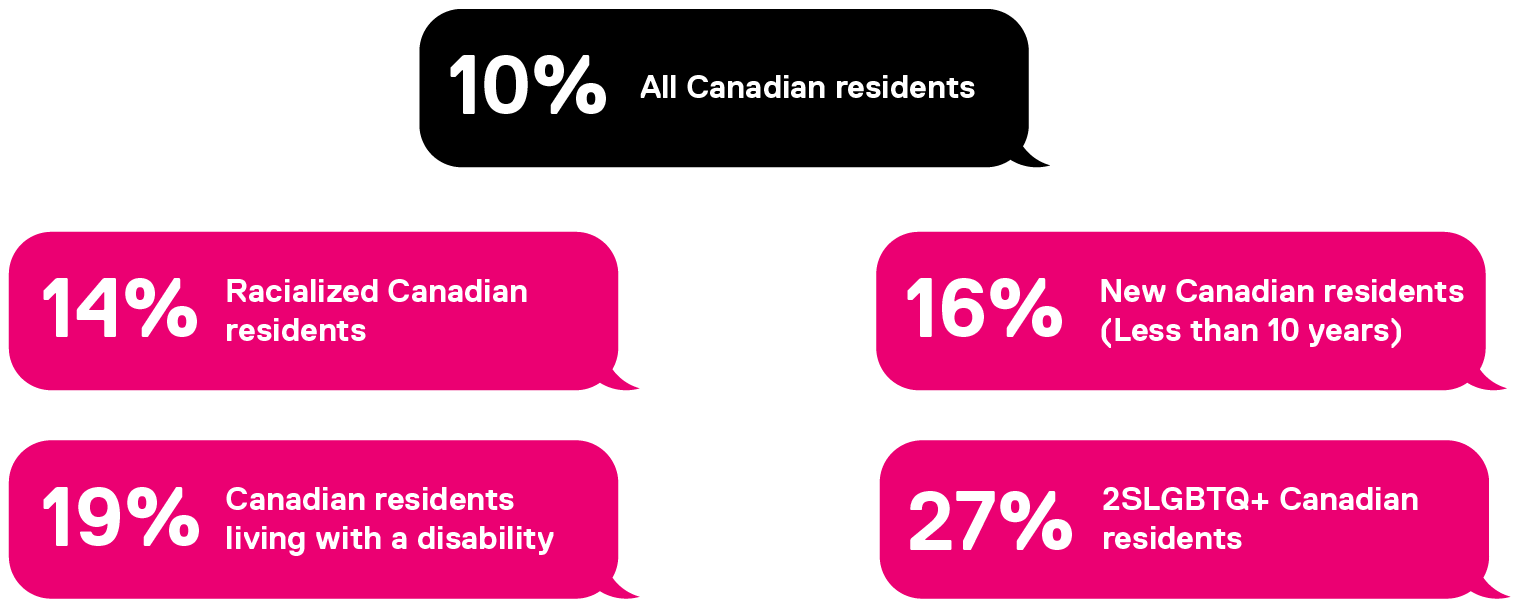
While most Canadian residents have seen harmful content online, fewer report being specifically targeted by it. Of those surveyed, 10 percent say they were specifically targeted by hate speech, the same overall rate as in 2022. This experience, however, is far more common for those with visible minority identities: 28 percent of Middle Eastern respondents (although the sample size of Middle Eastern respondents was small at n=33), 14 percent of Black and South Asian respondents, and 12 percent of East or Southeast Asian respondents report having been targeted by hate speech. While the sample size was small (n=22), 43% of Jewish respondents say they have been targeted by hate speech online. It is also more pronounced within the 2SLGBTQ+ community where 27 percent have been personally targeted by online hate speech. Among those living with a disability, 19 percent have experienced hate speech personally.
Figure 16 - Personal experience with online harms in Canada

Caption: "Have you ever experienced any of the following?”
Another eight percent report being targeted by harassment online that caused them to fear for their safety, also stable since 2022. The distribution of this is in line with the distribution of experiencing hate speech — 2SLGBTQ+ (16 percent) and those living with a disability (15 percent) are the most likely to also report harassment that caused them to fear for their safety.
Figure 17 - Online hate speech targeting vulnerable populations
Caption: "Have you ever experienced any of the following? - Been targeted with online hate speech that deliberately promoted hatred against a group you identify with”
Finally, four percent report having had intimate images of themselves shared online without their consent, again consistent with 2022. This is consistent across gender for both men and women but varies by age with eight percent of those under 30 having experienced it while only one percent of those over 60.
In fact, youth in Canada in general report higher levels of online harm. From exposure to hate speech and violent content, to personal targets of hate and harassment, levels among those aged 16 to 29 are 30 to 50 percent higher than the overall population.
Figure 18 - Youth exposure to online harms

Most platforms contain built-in tools for users to self-moderate the content they see and interact with, and while most Canadians have not used these, many have. Just under half (40 percent) say they have blocked, reported or flagged an account on an online platform specifically for being fake or automated
Figure 19 - Frequency of blocking and reporting online

Similarly, 25 percent have reported or flagged an account for sharing illegal content and 24 percent have blocked an account for sharing illegal content. Fewer have taken steps beyond the platforms to report content — only six percent say they have reported someone to the police for illegal online activity.
The perceived effectiveness of blocking, reporting, and flagging online content is mixed. While 34 percent of respondents say it was effective, 28 percent say that it was not effective, including 14 percent who say it was not at all effective. This assessment of its effectiveness has been stable since 2019.
Figure 20 - Perceived effectiveness of blocking and reporting online

Caption: “You mentioned that you have reported, blocked or flagged a person or account online. How would you rate the effectiveness of these actions where 1 is not at all effective and 9 is very effective?”
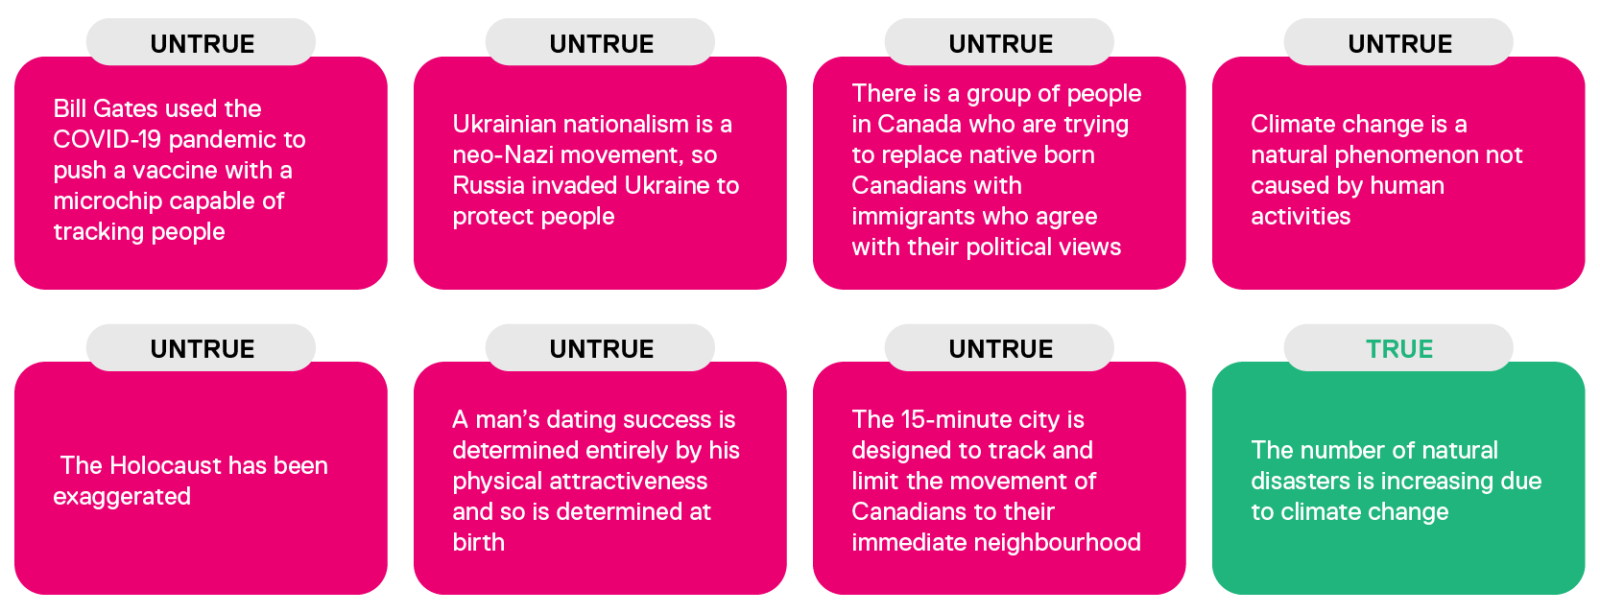
We asked respondents if they believe a range of statements to be true or false. Each statement was based on a common conspiracy or disinformation narrative. In most cases, the statements were false. However, one true statement — the number of natural disasters is increasing due to climate change — was included as a control. Based on the number of correctly identified misinformation statements, respondents are grouped into low, medium, or high misinformation groups.
The most common belief held by Canadians is that there is a group in Canada trying to replace native-born Canadians with immigrants who share their political views (or the “great replacement theory”) although still only 25 percent believe this statement is definitely or somewhat true. This belief has increased substantially since 2022, when only 16 percent thought the same. This increase is in line with increased conversation in the media surrounding the pace of immigration to Canada over the past few years, although mainstream conversation has not been focused on the idea of immigrants replacing existing Canadians.
Figure 21 - Distribution of eight correctly identified misinformation statements

Belief that climate change is not caused by human activities and that the 15-minute city concept is designed to track and limit the movement of Canadians are nearly as high with 23 percent and 20 percent of respondents believing them respectively. In the case of the 15-minute city statement, only 35 percent of respondents were able to correctly identify it as false — nearly half of Canadian residents (45 percent) remain unsure about it either due to a lack of familiarity with the concept or real indecision.
Belief in climate misinformation has remained stable since 2022. The proportion of respondents who believed climate change is not caused by human activities increased insignificantly from 22 percent to 23 percent. Likewise, the proportion who did not believe climate change is contributing to an increased number of natural disasters increased from 13 percent to 14 percent.
Figure 22 - Belief in misinformation in Canada

Caption: “How much truth do you think there is to each of the following statements?”
Although some of the questions used to create the misinformation index have changed since the previous iteration of this survey to incorporate newer narratives, overall levels of belief in common misinformation have remained more or less stable. Most respondents (54 percent) correctly identified at least six of the eight misinformation statements and only 11 percent got fewer than three statements correct.
While men and women were about equally likely to get at least six statements correct (52 percent of men and 55 percent of women), older respondents were far more likely to identify at least six correctly (62 percent of those 60 or older) compared to younger respondents (only 45 percent of those under 30). Similarly, both those earning higher incomes and those with a higher level of education were also more likely to correctly identify the misinformation statements.
Figure 23 - Belief in misinformation by demographics

Caption: Number of misinformation statements correctly identified. Non-binary respondents not shown due to small sample size (n<20).
The most significant differences come across the self-identified political spectrum. Those who say they are left leaning were significantly more likely to correctly identify misinformation: 78 percent got at least six out of eight statements right including 32 percent who correctly identified all eight. Right-leaning respondents were far less likely to get at least six correct, with 34 percent getting six or more correct and only 6 percent correctly identifying all eight.
For all statements, right-leaning respondents were significantly less likely to correctly identify misinformation than left-leaning or centrist respondents; however, the difference is largest for the two statements related to climate change. While 89 percent of left-leaning respondents and 73 percent of centrist respondents identified that climate change is caused by human activities, only 49 percent of right-leaning respondents did. Similarly, 93 percent of left-leaning respondents and 79 percent of centrists said the number of natural disasters is increasing due to climate change, while only 61 percent of right-leaning respondents said the same.
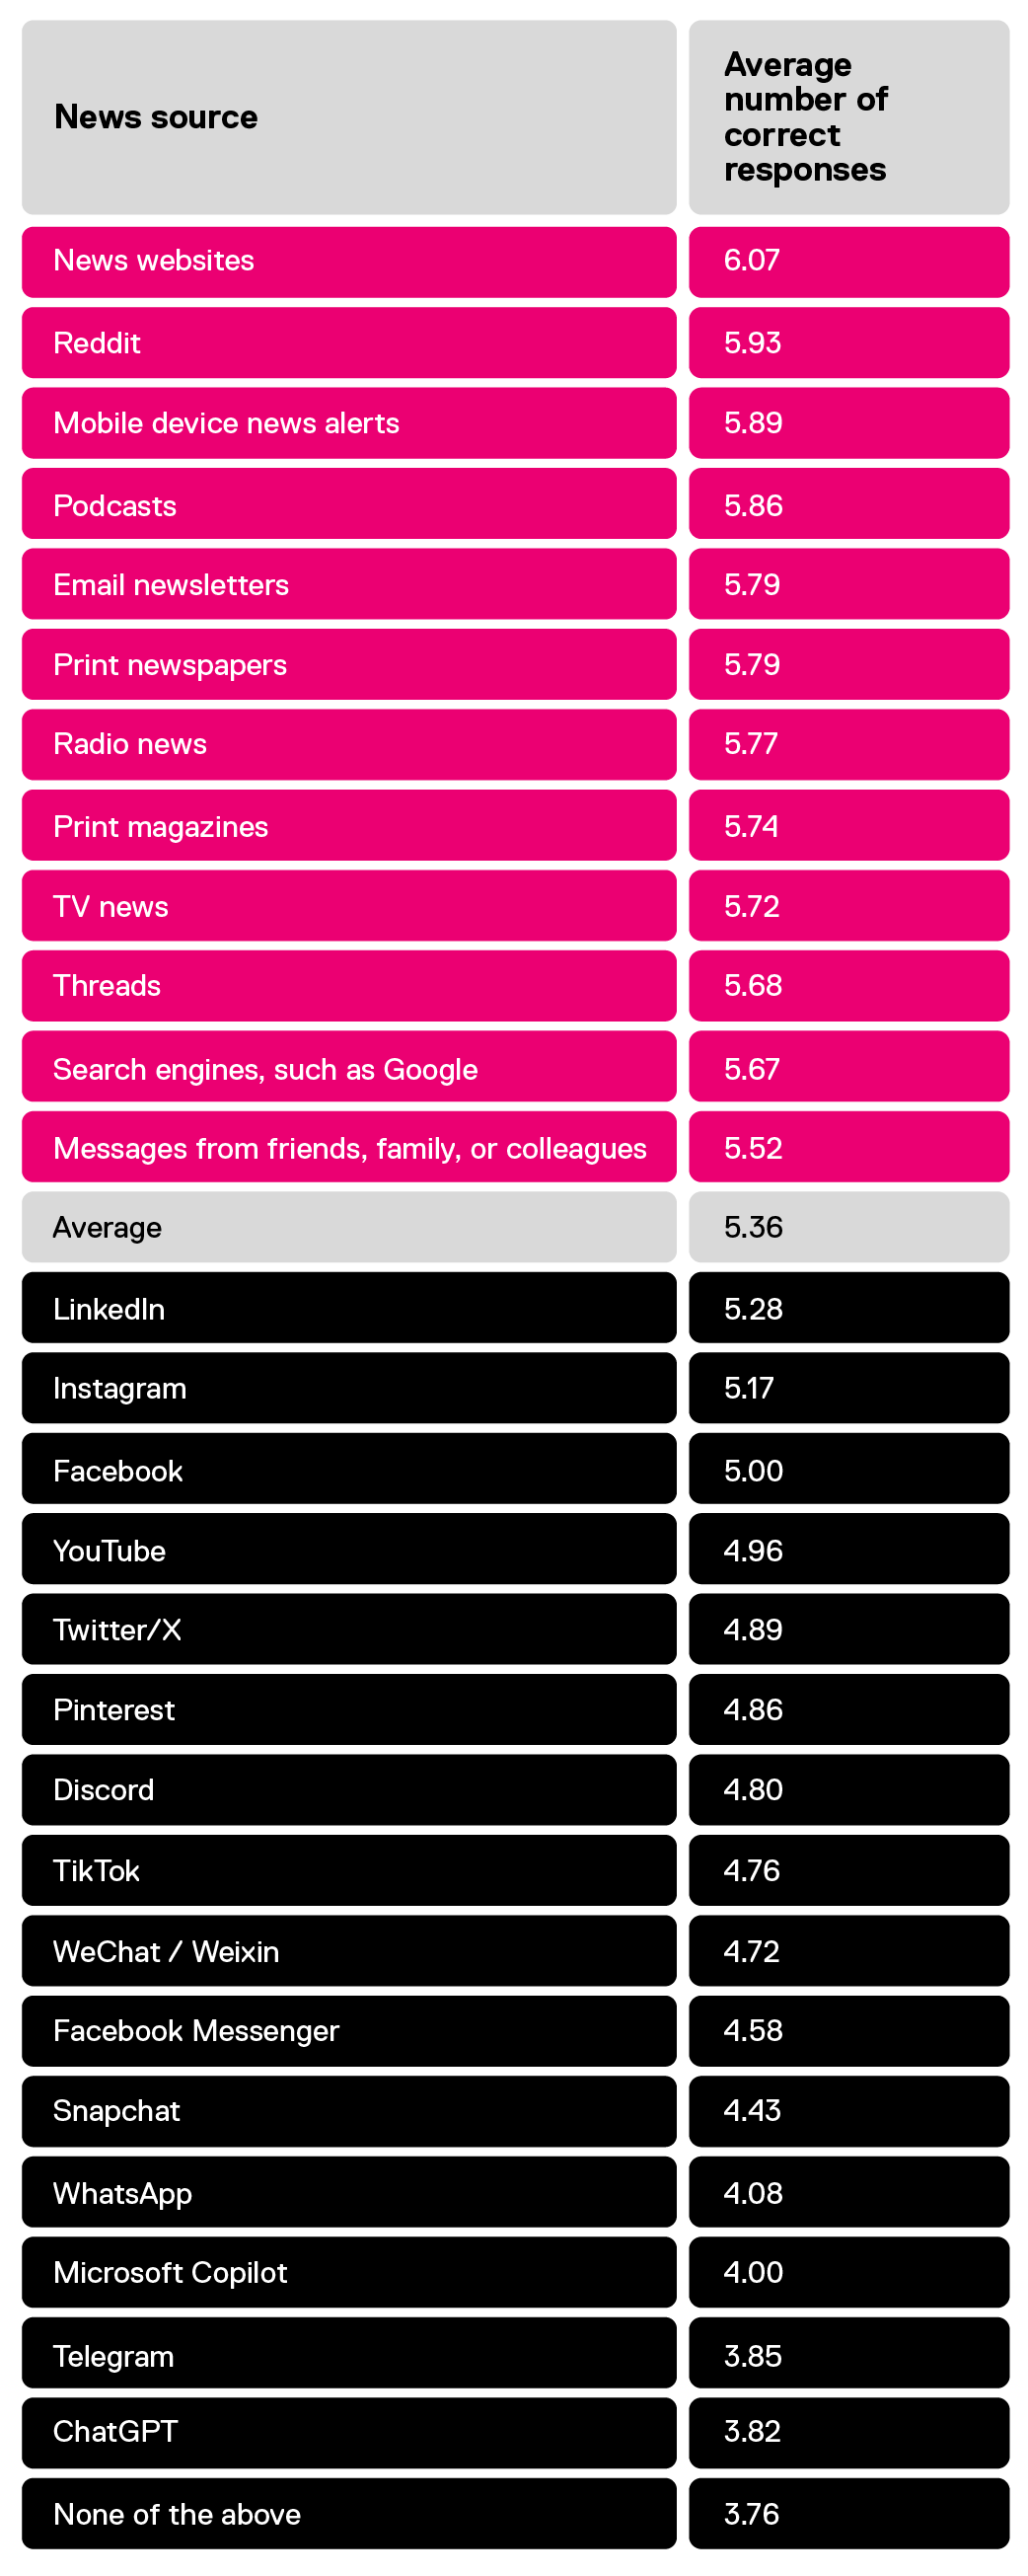
Unsurprisingly, the highest belief in misinformation is among those who say they do not follow the news on any platform, online or not. Similarly, those getting news from platforms that are not generally news sources such as generative AI platform ChatGPT, or the Telegram or WhatsApp messaging apps are also some of the most likely to believe misinformation.
At the other end of the spectrum, those who use traditional news sources, such as news websites, print newspapers, and the radio, tend to be less likely to believe misinformation. Of the various social media platforms tested, the Reddit network is associated with the lowest belief in misinformation — significantly better as a news source than any other social media platform.
Figure 24 - Average number of correctly identified misinformation statements by news source
Those with a high level of belief in misinformation are also much more likely to trust social media platforms to act in the public interest, while having much lower levels of trust in traditional news sources. For example, there is a 24 percent gap in trust in TikTok between high and low believers in misinformation (37 percent compared to 61 percent), which has grown by seven points since 2022. The gap for Twitter/X has grown even more dramatically to 36 points, up from nine points in 2022. On the flip side, low trust in CBC/Radio-Canada is much higher among high believers in misinformation compared to low believers (31 percent compared to 7 percent) — this gap of 24 points has also grown by seven points since 2022.
Figure 25 - Low trust in organizations by belief in misinformation

Caption: “On a scale of 1-9, where 1 means you have no trust at all and 9 means you have a high degree of trust, how do you feel about each of the following companies when it comes to trusting them to act in the best interest of the public” - Showing those who gave each platform between a 1 and a 3.
In a similar vein, those who pay for a digital news subscription are also more likely to have a low level of belief in misinformation, although they are still equally likely to have a high level of belief in misinformation too. The main shift is in the moderate group: while 37 percent of those who do not pay for digital news fall into the middle group, only 21 percent of those who do pay for digital news fall in the middle group.
Believers of misinformation are less likely to actively fact-check information they see, but they are to an extent more aware that they are seeing misinformation. Only 40 percent of those who believe high levels of misinformation say they have ever fact-checked something online using another source — significantly lower than the 72 percent of those who believe low levels of misinformation. That said, at least some in this group are aware that they see and sometimes believe false information — 23 percent say they see information they believe to be true but later find out is false at least a few times a week and 10 percent say they see it daily. Only 16 percent said they never see information that they believe and later find out to be false.
When looking at trust in sources to learn more about misinformation and digital literacy amongst respondents that had a high degree of belief in misinformation, trust significantly decreases compared to the overall population, most notably trust in news media (-26 percent), federal government (-23 percent), and their child’s school (-16 percent). Overall support among this group was highest for friends and family, with the public library following.
Those who believe misinformation are also more at risk when it comes to cryptocurrency. While a similar share of them have owned a crypto asset at any time in their life, those who have a high belief in misinformation also continue to have relatively high levels of trust in cryptocurrency exchanges. Trust in cryptocurrency exchanges was only 5 percent in those with low belief levels in misinformation, compared to 17 percent of those with a high belief level in misinformation.
Consistent with our findings from previous years, Canadian residents generally support government intervention in the spread of online harms, such as hate speech, harassment and false information. Though respondents blame online platform users themselves as most responsible for generating online harm, they believe that platforms are obligated to mitigate harm.
Figure 26 - Attribution of responsibility for rise in harmful online content in Canada

Caption: “There are concerns about a rise in harmful content such as hate speech, harassment and false information on large online platforms, like YouTube, Facebook or Instagram. Who do you think is most responsible for contributing to a rise in harmful online content, whether through action or inaction? And who do you think should be most responsible for fixing a rise in harmful online content?”
When asked about the responsibility of harmful online content, most respondents place the blame on the users of online platforms for causing online harm (46 percent), but say it is the platforms' responsibility to fix it (49 percent). Very few placed principal responsibility on government or political leaders. This is consistent with our findings from 2022; the percentage of respondents who believed platform users were to blame for harmful content went down by just two percent, as did the percentage of respondents who believed platforms were responsible for fixing it. Respondents who believed the government was causing online harm went up by one percent compared to last year, and those who believed the onus of fixing the problem lay with the government increased by two percent as compared to 2022.
We again asked survey participants to consider three pairs of statements and choose the one that best described their perspectives on government intervention in regulating online harms. We found that overall for each question, approximately two out of three Canadians were in favour of government intervention.
Figure 27 - Attitudes towards online platform regulation in Canada

Caption: “For each of the following pairs of statements, please indicate which of the following best describes your perspective.”
Overall, there have been no significant changes in attitudes towards intervention, either for or against regulation since 2021. On whether or not the government should have a role in intervening in online platforms, 68 percent of respondents agreed, while 32 percent did not believe governments should play a role in regulating platforms. This was only a one percent change compared to last year’s results, in favour of government intervention. The third question asked respondents if they believed that the spread of disinformation is a threat to Canadian democracy and needs to be addressed by the government, with two out of three respondents agreeing. This has been stable since 2022, when 66 percent agreed.
We can combine the results of these three questions to see how consistent Canadians are in their beliefs about regulating online speech. Doing so, we find that across the three trade-offs, 46 percent of respondents consistently picked the pro-regulation options, indicating that they always preferred action over inaction. Only 15 percent of respondents were consistently anti-regulation, and the remaining 39 percent of respondents were inconsistent with their answers between regulation and lack thereof.
Platform regulation
Figure 28 - Support for specific requirements for online platforms

Caption: “There have been a number of actions proposed to address harmful content on large online platforms, like YouTube, Facebook or Instagram. For each of the following, would you say you strongly support, somewhat support, are neutral, somewhat oppose or strongly oppose: Require platforms to…”
Canadians remained overwhelmingly in support of policy actions to address harmful content. When introduced to different actions that could be required to mitigate online harms, Canadians’ support for every action was at least 80 percent. Most respondents supported the requirement for platforms to remove child sexual material and report it to the police (92 percent), with support for the removal of non-consensual intimate images (88 percent) and accounts impersonating others (87 percent) following.
Opposition did not exceed five percent for any of the options, and was highest at five percent for the option to require platforms to quickly remove hate speech that deliberately promotes hatred against identifiable groups. Of the respondents who were against it, half were in the “high belief in misinformation” group based on our misinformation index. Overall, believers of misinformation were almost always more likely to oppose regulation than their counterparts.
Most notable changes compared to 2022 results include an increase for strong support for removing bot accounts (+4, now 68 percent), strong support for requiring platforms to develop specific measures for child users (+4, now 68 percent), and strong support for platforms labeling deepfakes (+4, now 64 percent), the latter of which may reflect reactions to a growing untrustworthy information landscape. Increase for these responses was largely driven by those in the “somewhat support” camp.
Figure 29 - Support for specific requirements for online platforms over time

Caption: “There have been a number of actions proposed to address harmful content on large online platforms, like YouTube, Facebook or Instagram. For each of the following, would you say you strongly support, somewhat support, are neutral, somewhat oppose or strongly oppose: Require platforms to…”. *Prior to 2022, question text read “Requiring that automated content or bot accounts be banned”
Online Harms Act
With the tabling of Bill C-63, the Online Harms Act, we asked survey respondents two questions to gauge their support for their preferred recourse mechanisms on the decisions of online platforms to remove content, and also to evaluate general sentiments about the proposed Online Harms Act itself.
Among three options for recourse mechanisms that are laid out in the new bill, most respondents (51 percent) supported the creation of a Digital Safety Commissioner that can audit and order platforms to remove illegal content, followed by respondents (44 percent) who believed online platforms should be required to have their own appeals mechanisms. This is followed by 37 percent of respondents who supported the creation of an independent ombudsperson to help users navigate platform appeals. Only three percent supported other options, seven percent said none of the above, and 16 percent were unsure. Most respondents who supported none of the above had a high degree of belief in misinformation.
Figure 30 - Awareness of Canada’s proposed Online Harms Act

Caption: “The Trudeau government has tabled the Online Harms Act to provide recourse to Canadians regarding decisions of large online platforms to remove illegal content, such as hate speech or promotion of violence. Before this survey, how familiar were you with the Online Harms Act?”
Familiarity with the Online Harms Act remains quite low. The majority of respondents were not familiar with the bill, with only nine percent clearly familiar. Among those who were at least vaguely familiar with the bill, there was 61 percent overall support of the proposed Online Harms Act, 20 percent who opposed, and 12 percent who were neutral. Women were generally more supportive of the act (70 percent) than men (55 percent), and the 60+ age group had the most support for the act at 70 percent. Our results were consistent with a report from Leger on Canadian’s general support for the Online Harms Act, where nearly 70 percent of respondents said they support the government’s plan to regulate online content.7
Figure 31 - Support for Canada’s proposed Online Harms Act

Caption: “From what you’ve heard, do you support or oppose the Online Harms Act?”
TikTok ban
Using the example of the recent government ban on the use of TikTok on the devices of public servants due to concerns about the potential risk of surveillance or interference from the Chinese government, we asked respondents if they were in support of a broader TikTok ban. Overall, 33 percent of respondents believed that TikTok should be banned completely in Canada, with 24 percent believing that it should only be banned for minors. Looking at the age distribution of responses, we found that 40 percent of those in the 16 to 29 age group believed TikTok should not be banned, while only 15 percent of those aged 60+ believed the same. A Leger report also found that young people opposed the TikTok ban more than older people.8
Figure 32 - Support for banning TikTok in Canada

Caption: “TikTok was banned on government devices in Canada following concerns about the potential risk of surveillance or interference from the Chinese government, given TikTok’s parent company is based in China. Which of the following best describes your perspective”
1
Todd C. Helmus, (Artificial Intelligence, Deepfakes, and Disinformation: A Primer. (RAND Corporation, 2022), http://www.jstor.org/stable/resrep42027.
2
Rebecca Umbach, Nicola Henry, Gemma Beard, and Colleen Berryessa, Non-Consensual Synthetic Intimate Imagery: Prevalence, Attitudes, and Knowledge in 10 Countries. Proceedings of the CHI Conference on Human Factors in Computing Systems (New York: Association for Computing Machinery, 2024) 779, 1–20. https://doi.org/10.1145/3613904.3642382.
3
P. Lorenz, K. Perset and J. Berryhill, “Initial Policy Considerations for Generative Artificial Intelligence” OECD Artificial Intelligence Papers, No. 1 (Paris: OECD Publishing, 2023), https://doi.org/10.1787/fae2d1e6-en.
4
Respondents were asked “If you were to place yourself on a political spectrum where 1 means all the way to the far left and 9 means all the way to the far right, however you understand “left/right”, where would you place yourself?” Left was defined as 1-3 and right defined as 7-9.
5
Sarah Scire, Canada Offered a Tax Credit to Encourage Digital News Subscriptions. Here’s How It’s Going,” Nieman Lab, April 26, 2022, https://www.niemanlab.org/2022/04/canada-offered-a-tax-credit-to-encourage-digital-news-subscriptions-heres-how-its-going/.
6
Colette Brin and Sebastien Charlton, *Digital News Report 2024: Canada,* Reuters Institute for the Study of Journalism, University of Oxford, 2024, https://reutersinstitute.politics.ox.ac.uk/digital-news-report/2024/canada.
7
Leger, “Online Content Regulation: Survey of Canadians, April 2024, https://leger360.com/wp-content/uploads/2024/04/Leger-x-CP-_-Online_Content_Regulation-1.pdf.
8
Ibid.